0001616262
Rocky Mountain Chocolate Factory, Inc.
false
--02-28
FY
2023
646,394
620,798
625,526
666,315
804,815
35,173
47,228
38,778
65,059
0.001
0.001
250,000
250,000
0
0
0
0
0.001
0.001
46,000,000
46,000,000
6,257,137
6,257,137
6,186,356
6,186,356
2
5
39
5
6
1
1
1
1
1
1
10
3
5
10
5
20
10
5
10
70,000
6
18
5
6
0
488,695
0.08
0.03
0.08
0.03
70,000
00016162622022-03-012023-02-28
iso4217:USD
00016162622022-08-31
xbrli:shares
00016162622023-05-19
thunderdome:item
0001616262us-gaap:ProductMember2022-03-012023-02-28
0001616262us-gaap:ProductMember2021-03-012022-02-28
0001616262us-gaap:ProductMember2020-03-012021-02-28
0001616262rmcf:FranchiseAndRoyaltyFeesMember2022-03-012023-02-28
0001616262rmcf:FranchiseAndRoyaltyFeesMember2021-03-012022-02-28
0001616262rmcf:FranchiseAndRoyaltyFeesMember2020-03-012021-02-28
00016162622021-03-012022-02-28
00016162622020-03-012021-02-28
0001616262us-gaap:FranchiseMember2022-03-012023-02-28
0001616262us-gaap:FranchiseMember2021-03-012022-02-28
0001616262us-gaap:FranchiseMember2020-03-012021-02-28
0001616262us-gaap:RetailMember2022-03-012023-02-28
0001616262us-gaap:RetailMember2021-03-012022-02-28
0001616262us-gaap:RetailMember2020-03-012021-02-28
iso4217:USDxbrli:shares
00016162622023-02-28
00016162622022-02-28
0001616262us-gaap:CommonStockMember2022-02-28
0001616262us-gaap:CommonStockMember2021-02-28
0001616262us-gaap:CommonStockMember2020-02-29
0001616262us-gaap:CommonStockMember2022-03-012023-02-28
0001616262us-gaap:CommonStockMember2021-03-012022-02-28
0001616262us-gaap:CommonStockMember2020-03-012021-02-28
0001616262us-gaap:CommonStockMember2023-02-28
0001616262us-gaap:AdditionalPaidInCapitalMember2022-02-28
0001616262us-gaap:AdditionalPaidInCapitalMember2021-02-28
0001616262us-gaap:AdditionalPaidInCapitalMember2020-02-29
0001616262us-gaap:AdditionalPaidInCapitalMember2022-03-012023-02-28
0001616262us-gaap:AdditionalPaidInCapitalMember2021-03-012022-02-28
0001616262us-gaap:AdditionalPaidInCapitalMember2020-03-012021-02-28
0001616262us-gaap:AdditionalPaidInCapitalMember2023-02-28
0001616262us-gaap:RetainedEarningsMember2022-02-28
0001616262us-gaap:RetainedEarningsMember2021-02-28
0001616262us-gaap:RetainedEarningsMember2020-02-29
0001616262us-gaap:RetainedEarningsMember2022-03-012023-02-28
0001616262us-gaap:RetainedEarningsMember2021-03-012022-02-28
0001616262us-gaap:RetainedEarningsMember2020-03-012021-02-28
0001616262us-gaap:RetainedEarningsMember2023-02-28
00016162622021-02-28
00016162622020-02-29
0001616262rmcf:EdibleMember2022-03-012023-02-28
0001616262rmcf:EdibleMember2021-03-012022-02-28
0001616262rmcf:EdibleMember2020-03-012021-02-28
xbrli:pure
0001616262rmcf:RockyMountainChocolateFactoryMemberrmcf:CompanyOwnedStoresMemberrmcf:StoresOpenedAt2282022Member2023-02-28
0001616262rmcf:RockyMountainChocolateFactoryMemberrmcf:CompanyOwnedStoresMemberrmcf:OpenMember2023-02-28
0001616262rmcf:RockyMountainChocolateFactoryMemberrmcf:CompanyOwnedStoresMemberrmcf:ClosedMember2023-02-28
0001616262rmcf:RockyMountainChocolateFactoryMemberrmcf:CompanyOwnedStoresMemberrmcf:SoldMember2023-02-28
0001616262rmcf:RockyMountainChocolateFactoryMemberrmcf:CompanyOwnedStoresMemberrmcf:StoresOpenedAt22823Member2023-02-28
0001616262rmcf:RockyMountainChocolateFactoryMemberrmcf:CompanyOwnedStoresMemberrmcf:SoldNotYetOpenMember2023-02-28
0001616262rmcf:RockyMountainChocolateFactoryMemberrmcf:CompanyOwnedStoresMember2023-02-28
0001616262rmcf:RockyMountainChocolateFactoryMemberrmcf:FranchiseStoresDomesticStoresAndKiosksMemberrmcf:StoresOpenedAt2282022Member2023-02-28
0001616262rmcf:RockyMountainChocolateFactoryMemberrmcf:FranchiseStoresDomesticStoresAndKiosksMemberrmcf:OpenMember2023-02-28
0001616262rmcf:RockyMountainChocolateFactoryMemberrmcf:FranchiseStoresDomesticStoresAndKiosksMemberrmcf:ClosedMember2023-02-28
0001616262rmcf:RockyMountainChocolateFactoryMemberrmcf:FranchiseStoresDomesticStoresAndKiosksMemberrmcf:SoldMember2023-02-28
0001616262rmcf:RockyMountainChocolateFactoryMemberrmcf:FranchiseStoresDomesticStoresAndKiosksMemberrmcf:StoresOpenedAt22823Member2023-02-28
0001616262rmcf:RockyMountainChocolateFactoryMemberrmcf:FranchiseStoresDomesticStoresAndKiosksMemberrmcf:SoldNotYetOpenMember2023-02-28
0001616262rmcf:RockyMountainChocolateFactoryMemberrmcf:FranchiseStoresDomesticStoresAndKiosksMember2023-02-28
0001616262rmcf:RockyMountainChocolateFactoryMemberrmcf:InternationalLicenseStoresMemberrmcf:StoresOpenedAt2282022Member2023-02-28
0001616262rmcf:RockyMountainChocolateFactoryMemberrmcf:InternationalLicenseStoresMemberrmcf:OpenMember2023-02-28
0001616262rmcf:RockyMountainChocolateFactoryMemberrmcf:InternationalLicenseStoresMemberrmcf:ClosedMember2023-02-28
0001616262rmcf:RockyMountainChocolateFactoryMemberrmcf:InternationalLicenseStoresMemberrmcf:SoldMember2023-02-28
0001616262rmcf:RockyMountainChocolateFactoryMemberrmcf:InternationalLicenseStoresMemberrmcf:StoresOpenedAt22823Member2023-02-28
0001616262rmcf:RockyMountainChocolateFactoryMemberrmcf:InternationalLicenseStoresMemberrmcf:SoldNotYetOpenMember2023-02-28
0001616262rmcf:RockyMountainChocolateFactoryMemberrmcf:InternationalLicenseStoresMember2023-02-28
0001616262rmcf:RockyMountainChocolateFactoryMemberrmcf:ColdStoneCreameryCobrandedMemberrmcf:StoresOpenedAt2282022Member2023-02-28
0001616262rmcf:RockyMountainChocolateFactoryMemberrmcf:ColdStoneCreameryCobrandedMemberrmcf:OpenMember2023-02-28
0001616262rmcf:RockyMountainChocolateFactoryMemberrmcf:ColdStoneCreameryCobrandedMemberrmcf:ClosedMember2023-02-28
0001616262rmcf:RockyMountainChocolateFactoryMemberrmcf:ColdStoneCreameryCobrandedMemberrmcf:SoldMember2023-02-28
0001616262rmcf:RockyMountainChocolateFactoryMemberrmcf:ColdStoneCreameryCobrandedMemberrmcf:StoresOpenedAt22823Member2023-02-28
0001616262rmcf:RockyMountainChocolateFactoryMemberrmcf:ColdStoneCreameryCobrandedMemberrmcf:SoldNotYetOpenMember2023-02-28
0001616262rmcf:RockyMountainChocolateFactoryMemberrmcf:ColdStoneCreameryCobrandedMember2023-02-28
0001616262rmcf:RockyMountainChocolateFactoryMemberrmcf:USwirlIncMemberrmcf:StoresOpenedAt2282022Member2023-02-28
0001616262rmcf:RockyMountainChocolateFactoryMemberrmcf:USwirlIncMemberrmcf:OpenMember2023-02-28
0001616262rmcf:RockyMountainChocolateFactoryMemberrmcf:USwirlIncMemberrmcf:ClosedMember2023-02-28
0001616262rmcf:RockyMountainChocolateFactoryMemberrmcf:USwirlIncMemberrmcf:SoldMember2023-02-28
0001616262rmcf:RockyMountainChocolateFactoryMemberrmcf:USwirlIncMemberrmcf:StoresOpenedAt22823Member2023-02-28
0001616262rmcf:RockyMountainChocolateFactoryMemberrmcf:USwirlIncMemberrmcf:SoldNotYetOpenMember2023-02-28
0001616262rmcf:RockyMountainChocolateFactoryMemberrmcf:USwirlIncMember2023-02-28
0001616262rmcf:StoresOpenedAt2282022Member2023-02-28
0001616262rmcf:OpenMember2023-02-28
0001616262rmcf:ClosedMember2023-02-28
0001616262rmcf:SoldMember2023-02-28
0001616262rmcf:StoresOpenedAt22823Member2023-02-28
0001616262rmcf:SoldNotYetOpenMember2023-02-28
0001616262srt:MinimumMember2023-02-28
0001616262srt:MaximumMember2023-02-28
utr:Y
0001616262srt:MinimumMember2022-03-28
0001616262srt:MaximumMember2022-03-28
0001616262us-gaap:FranchiseRightsMembersrt:MinimumMember2023-02-28
0001616262srt:MinimumMember2021-03-012022-02-28
0001616262srt:MaximumMember2021-03-012022-02-28
0001616262us-gaap:RestrictedStockUnitsRSUMemberus-gaap:ShareBasedPaymentArrangementNonemployeeMember2022-03-012023-02-28
0001616262us-gaap:RestrictedStockUnitsRSUMemberus-gaap:ShareBasedPaymentArrangementNonemployeeMember2021-03-012022-02-28
0001616262us-gaap:RestrictedStockMembersrt:MinimumMemberrmcf:AnnualVestingMember2022-03-012023-02-28
0001616262us-gaap:RestrictedStockUnitsRSUMembersrt:MaximumMemberrmcf:AnnualVestingMember2021-03-012022-02-28
0001616262us-gaap:RestrictedStockUnitsRSUMemberrmcf:AnnualVestingMember2021-03-012022-02-28
0001616262us-gaap:RestrictedStockUnitsRSUMembersrt:MinimumMember2021-03-012022-02-28
0001616262us-gaap:RestrictedStockUnitsRSUMembersrt:MaximumMember2021-03-012022-02-28
0001616262us-gaap:RestrictedStockUnitsRSUMember2022-03-012023-02-28
0001616262us-gaap:RestrictedStockUnitsRSUMember2021-03-012022-02-28
0001616262us-gaap:RestrictedStockUnitsRSUMember2021-02-28
0001616262us-gaap:RestrictedStockUnitsRSUMemberus-gaap:ShareBasedPaymentArrangementEmployeeMember2023-02-28
0001616262us-gaap:RestrictedStockUnitsRSUMemberus-gaap:ShareBasedPaymentArrangementEmployeeMember2022-03-012023-02-28
0001616262us-gaap:ShareBasedPaymentArrangementNonemployeeMember2021-03-012022-02-28
0001616262us-gaap:ShareBasedPaymentArrangementNonemployeeMember2022-03-012023-02-28
0001616262us-gaap:ShareBasedPaymentArrangementNonemployeeMember2020-03-012021-02-28
0001616262srt:ChiefExecutiveOfficerMember2022-03-012023-02-28
0001616262us-gaap:PerformanceSharesMembersrt:MaximumMembersrt:ChiefExecutiveOfficerMember2022-03-012023-02-28
0001616262us-gaap:PerformanceSharesMembersrt:ChiefExecutiveOfficerMember2022-03-012023-02-28
0001616262us-gaap:PerformanceSharesMembersrt:ChiefExecutiveOfficerMemberrmcf:VestingOnLastDayOfCurrentFiscalYearEndingMember2022-03-012023-02-28
0001616262us-gaap:PerformanceSharesMembersrt:MinimumMembersrt:ChiefExecutiveOfficerMember2022-03-012023-02-28
0001616262us-gaap:WarrantMember2022-03-012023-02-28
0001616262rmcf:UnvestedRestrictedStockUnitsMember2022-03-012023-02-28
0001616262us-gaap:WarrantMember2021-03-012022-02-28
0001616262rmcf:UnvestedRestrictedStockUnitsMember2021-03-012022-02-28
0001616262us-gaap:WarrantMember2020-03-012021-02-28
0001616262rmcf:UnvestedRestrictedStockUnitsMember2020-03-012021-02-28
0001616262rmcf:RockyMountainChocolateFactoryMember2022-03-012023-02-28
0001616262rmcf:RockyMountainChocolateFactoryMember2021-03-012022-02-28
0001616262rmcf:RockyMountainChocolateFactoryMember2020-03-012021-02-28
0001616262rmcf:USwirlIncMemberus-gaap:SubsequentEventMember2023-05-01
0001616262rmcf:USwirlIncMemberus-gaap:SubsequentEventMember2023-05-012023-05-01
0001616262us-gaap:SubsequentEventMember2023-05-082023-05-08
0001616262us-gaap:RestrictedStockUnitsRSUMemberus-gaap:SubsequentEventMember2023-05-082023-05-08
0001616262srt:MaximumMemberus-gaap:SubsequentEventMember2023-05-082023-05-08
0001616262srt:MaximumMember2022-03-012023-02-28
0001616262srt:MinimumMember2022-03-012023-02-28
00016162622024-03-012023-02-28
00016162622025-03-012023-02-28
00016162622026-03-012023-02-28
00016162622027-03-012023-02-28
00016162622028-03-012023-02-28
00016162622029-03-012023-02-28
0001616262rmcf:FranchiseFeesMemberrmcf:FranchisingMemberus-gaap:TransferredOverTimeMember2022-03-012023-02-28
0001616262rmcf:FranchiseFeesMemberrmcf:ManufacturingMemberus-gaap:TransferredOverTimeMember2022-03-012023-02-28
0001616262rmcf:FranchiseFeesMemberrmcf:RetailSegmentMemberus-gaap:TransferredOverTimeMember2022-03-012023-02-28
0001616262rmcf:FranchiseFeesMemberrmcf:USwirlIncMemberus-gaap:TransferredOverTimeMember2022-03-012023-02-28
0001616262rmcf:FactorySalesMemberrmcf:FranchisingMemberus-gaap:TransferredAtPointInTimeMember2022-03-012023-02-28
0001616262rmcf:FactorySalesMemberrmcf:ManufacturingMemberus-gaap:TransferredAtPointInTimeMember2022-03-012023-02-28
0001616262rmcf:FactorySalesMemberrmcf:RetailSegmentMemberus-gaap:TransferredAtPointInTimeMember2022-03-012023-02-28
0001616262rmcf:FactorySalesMemberrmcf:USwirlIncMemberus-gaap:TransferredAtPointInTimeMember2022-03-012023-02-28
0001616262us-gaap:RetailMemberrmcf:FranchisingMemberus-gaap:TransferredAtPointInTimeMember2022-03-012023-02-28
0001616262us-gaap:RetailMemberrmcf:ManufacturingMemberus-gaap:TransferredAtPointInTimeMember2022-03-012023-02-28
0001616262us-gaap:RetailMemberrmcf:RetailSegmentMemberus-gaap:TransferredAtPointInTimeMember2022-03-012023-02-28
0001616262us-gaap:RetailMemberrmcf:USwirlIncMemberus-gaap:TransferredAtPointInTimeMember2022-03-012023-02-28
0001616262rmcf:RoyaltyAndMarketingFeesMemberrmcf:FranchisingMemberus-gaap:TransferredAtPointInTimeMember2022-03-012023-02-28
0001616262rmcf:RoyaltyAndMarketingFeesMemberrmcf:ManufacturingMemberus-gaap:TransferredAtPointInTimeMember2022-03-012023-02-28
0001616262rmcf:RoyaltyAndMarketingFeesMemberrmcf:RetailSegmentMemberus-gaap:TransferredAtPointInTimeMember2022-03-012023-02-28
0001616262rmcf:RoyaltyAndMarketingFeesMemberrmcf:USwirlIncMemberus-gaap:TransferredAtPointInTimeMember2022-03-012023-02-28
0001616262rmcf:FranchisingMemberus-gaap:TransferredAtPointInTimeMember2022-03-012023-02-28
0001616262rmcf:ManufacturingMemberus-gaap:TransferredAtPointInTimeMember2022-03-012023-02-28
0001616262rmcf:RetailSegmentMemberus-gaap:TransferredAtPointInTimeMember2022-03-012023-02-28
0001616262rmcf:USwirlIncMemberus-gaap:TransferredAtPointInTimeMember2022-03-012023-02-28
0001616262rmcf:FranchiseFeesMemberrmcf:FranchisingMemberus-gaap:TransferredOverTimeMember2021-03-012022-02-28
0001616262rmcf:FranchiseFeesMemberrmcf:ManufacturingMemberus-gaap:TransferredOverTimeMember2021-03-012022-02-28
0001616262rmcf:FranchiseFeesMemberrmcf:RetailSegmentMemberus-gaap:TransferredOverTimeMember2021-03-012022-02-28
0001616262rmcf:FranchiseFeesMemberrmcf:USwirlIncMemberus-gaap:TransferredOverTimeMember2021-03-012022-02-28
0001616262rmcf:FactorySalesMemberrmcf:FranchisingMemberus-gaap:TransferredAtPointInTimeMember2021-03-012022-02-28
0001616262rmcf:FactorySalesMemberrmcf:ManufacturingMemberus-gaap:TransferredAtPointInTimeMember2021-03-012022-02-28
0001616262rmcf:FactorySalesMemberrmcf:RetailSegmentMemberus-gaap:TransferredAtPointInTimeMember2021-03-012022-02-28
0001616262rmcf:FactorySalesMemberrmcf:USwirlIncMemberus-gaap:TransferredAtPointInTimeMember2021-03-012022-02-28
0001616262us-gaap:RetailMemberrmcf:FranchisingMemberus-gaap:TransferredAtPointInTimeMember2021-03-012022-02-28
0001616262us-gaap:RetailMemberrmcf:ManufacturingMemberus-gaap:TransferredAtPointInTimeMember2021-03-012022-02-28
0001616262us-gaap:RetailMemberrmcf:RetailSegmentMemberus-gaap:TransferredAtPointInTimeMember2021-03-012022-02-28
0001616262us-gaap:RetailMemberrmcf:USwirlIncMemberus-gaap:TransferredAtPointInTimeMember2021-03-012022-02-28
0001616262rmcf:RoyaltyAndMarketingFeesMemberrmcf:FranchisingMemberus-gaap:TransferredAtPointInTimeMember2021-03-012022-02-28
0001616262rmcf:RoyaltyAndMarketingFeesMemberrmcf:ManufacturingMemberus-gaap:TransferredAtPointInTimeMember2021-03-012022-02-28
0001616262rmcf:RoyaltyAndMarketingFeesMemberrmcf:RetailSegmentMemberus-gaap:TransferredAtPointInTimeMember2021-03-012022-02-28
0001616262rmcf:RoyaltyAndMarketingFeesMemberrmcf:USwirlIncMemberus-gaap:TransferredAtPointInTimeMember2021-03-012022-02-28
0001616262rmcf:FranchisingMemberus-gaap:TransferredAtPointInTimeMember2021-03-012022-02-28
0001616262rmcf:ManufacturingMemberus-gaap:TransferredAtPointInTimeMember2021-03-012022-02-28
0001616262rmcf:RetailSegmentMemberus-gaap:TransferredAtPointInTimeMember2021-03-012022-02-28
0001616262rmcf:USwirlIncMemberus-gaap:TransferredAtPointInTimeMember2021-03-012022-02-28
0001616262rmcf:FranchiseFeesMemberrmcf:FranchisingMemberus-gaap:TransferredOverTimeMember2020-03-012021-02-28
0001616262rmcf:FranchiseFeesMemberrmcf:ManufacturingMemberus-gaap:TransferredOverTimeMember2020-03-012021-02-28
0001616262rmcf:FranchiseFeesMemberrmcf:RetailSegmentMemberus-gaap:TransferredOverTimeMember2020-03-012021-02-28
0001616262rmcf:FranchiseFeesMemberrmcf:USwirlIncMemberus-gaap:TransferredOverTimeMember2020-03-012021-02-28
0001616262rmcf:FactorySalesMemberrmcf:FranchisingMemberus-gaap:TransferredAtPointInTimeMember2020-03-012021-02-28
0001616262rmcf:FactorySalesMemberrmcf:ManufacturingMemberus-gaap:TransferredAtPointInTimeMember2020-03-012021-02-28
0001616262rmcf:FactorySalesMemberrmcf:RetailSegmentMemberus-gaap:TransferredAtPointInTimeMember2020-03-012021-02-28
0001616262rmcf:FactorySalesMemberrmcf:USwirlIncMemberus-gaap:TransferredAtPointInTimeMember2020-03-012021-02-28
0001616262us-gaap:RetailMemberrmcf:FranchisingMemberus-gaap:TransferredAtPointInTimeMember2020-03-012021-02-28
0001616262us-gaap:RetailMemberrmcf:ManufacturingMemberus-gaap:TransferredAtPointInTimeMember2020-03-012021-02-28
0001616262us-gaap:RetailMemberrmcf:RetailSegmentMemberus-gaap:TransferredAtPointInTimeMember2020-03-012021-02-28
0001616262us-gaap:RetailMemberrmcf:USwirlIncMemberus-gaap:TransferredAtPointInTimeMember2020-03-012021-02-28
0001616262rmcf:RoyaltyAndMarketingFeesMemberrmcf:FranchisingMemberus-gaap:TransferredAtPointInTimeMember2020-03-012021-02-28
0001616262rmcf:RoyaltyAndMarketingFeesMemberrmcf:ManufacturingMemberus-gaap:TransferredAtPointInTimeMember2020-03-012021-02-28
0001616262rmcf:RoyaltyAndMarketingFeesMemberrmcf:RetailSegmentMemberus-gaap:TransferredAtPointInTimeMember2020-03-012021-02-28
0001616262rmcf:RoyaltyAndMarketingFeesMemberrmcf:USwirlIncMemberus-gaap:TransferredAtPointInTimeMember2020-03-012021-02-28
0001616262rmcf:FranchisingMemberus-gaap:TransferredAtPointInTimeMember2020-03-012021-02-28
0001616262rmcf:ManufacturingMemberus-gaap:TransferredAtPointInTimeMember2020-03-012021-02-28
0001616262rmcf:RetailSegmentMemberus-gaap:TransferredAtPointInTimeMember2020-03-012021-02-28
0001616262rmcf:USwirlIncMemberus-gaap:TransferredAtPointInTimeMember2020-03-012021-02-28
0001616262us-gaap:LandMember2023-02-28
0001616262us-gaap:LandMember2022-02-28
0001616262us-gaap:BuildingMember2023-02-28
0001616262us-gaap:BuildingMember2022-02-28
0001616262us-gaap:MachineryAndEquipmentMember2023-02-28
0001616262us-gaap:MachineryAndEquipmentMember2022-02-28
0001616262us-gaap:FurnitureAndFixturesMember2023-02-28
0001616262us-gaap:FurnitureAndFixturesMember2022-02-28
0001616262us-gaap:LeaseholdImprovementsMember2023-02-28
0001616262us-gaap:LeaseholdImprovementsMember2022-02-28
0001616262us-gaap:TransportationEquipmentMember2023-02-28
0001616262us-gaap:TransportationEquipmentMember2022-02-28
0001616262rmcf:StoreDesignMember2023-02-28
0001616262rmcf:StoreDesignMember2022-02-28
0001616262rmcf:PackagingLicensesMembersrt:MinimumMember2023-02-28
0001616262rmcf:PackagingLicensesMembersrt:MaximumMember2023-02-28
0001616262rmcf:PackagingLicensesMember2023-02-28
0001616262rmcf:PackagingLicensesMember2022-02-28
0001616262rmcf:PackagingDesignMember2023-02-28
0001616262rmcf:PackagingDesignMember2022-02-28
0001616262rmcf:TrademarksAndNonCompetitionAgreementMembersrt:MinimumMember2023-02-28
0001616262rmcf:TrademarksAndNonCompetitionAgreementMembersrt:MaximumMember2023-02-28
0001616262rmcf:TrademarksAndNonCompetitionAgreementMember2023-02-28
0001616262rmcf:TrademarksAndNonCompetitionAgreementMember2022-02-28
0001616262rmcf:CompanyStoresGoodwillMember2023-02-28
0001616262rmcf:CompanyStoresGoodwillMember2022-02-28
0001616262rmcf:FranchisingGoodwillMember2023-02-28
0001616262rmcf:FranchisingGoodwillMember2022-02-28
0001616262rmcf:ManufacturingSegmentGoodwillMember2023-02-28
0001616262rmcf:ManufacturingSegmentGoodwillMember2022-02-28
0001616262us-gaap:TrademarksMember2023-02-28
0001616262us-gaap:TrademarksMember2022-02-28
0001616262rmcf:CompanyStoresGoodwillMember2022-03-012023-02-28
0001616262us-gaap:GeneralAndAdministrativeExpenseMemberrmcf:Covid19PandemicMember2020-03-012020-05-31
0001616262us-gaap:GeneralAndAdministrativeExpenseMemberrmcf:Covid19PandemicMember2022-03-012023-02-28
0001616262rmcf:WellsFargoBankMemberus-gaap:LineOfCreditMember2022-03-012023-02-28
0001616262rmcf:WellsFargoBankMemberus-gaap:LineOfCreditMember2023-02-28
0001616262rmcf:WellsFargoBankMemberus-gaap:LineOfCreditMemberus-gaap:SecuredOvernightFinancingRateSofrOvernightIndexSwapRateMember2021-03-012022-02-28
0001616262rmcf:WellsFargoBankMemberus-gaap:LineOfCreditMemberus-gaap:SecuredOvernightFinancingRateSofrOvernightIndexSwapRateMember2023-02-28
0001616262rmcf:EquityIncentivePlan2007Member2022-02-28
0001616262rmcf:EquityIncentivePlan2007Member2022-03-012023-02-28
0001616262rmcf:EquityIncentivePlan2007Member2023-02-28
0001616262us-gaap:RestrictedStockUnitsRSUMember2022-02-28
0001616262us-gaap:RestrictedStockUnitsRSUMember2020-02-29
0001616262us-gaap:RestrictedStockUnitsRSUMember2020-03-012021-02-28
0001616262us-gaap:RestrictedStockUnitsRSUMember2023-02-28
0001616262srt:MaximumMember2022-11-30
0001616262srt:MinimumMember2022-11-30
0001616262rmcf:RetailLeasesMember2022-03-012023-02-28
0001616262rmcf:RetailLeasesMember2021-03-012022-02-28
0001616262rmcf:RetailLeasesMember2020-03-012021-02-28
0001616262us-gaap:AccountingStandardsUpdate201602Member2019-03-01
0001616262rmcf:LeasesForEquipmentMember2023-02-28
0001616262rmcf:WarehouseSpaceMember2023-02-28
0001616262rmcf:WarehouseSpaceMember2022-02-28
0001616262rmcf:WarehouseSpaceMember2021-02-28
00016162622022-03-012022-11-30
0001616262us-gaap:RestrictedStockUnitsRSUMemberrmcf:FormerSeniorVicePresidentSalesAndMarketingMember2022-09-302022-09-30
0001616262rmcf:FormerSeniorVicePresidentSalesAndMarketingMember2022-09-302022-09-30
0001616262rmcf:FormerSeniorVicePresidentSalesAndMarketingMember2022-09-30
utr:M
0001616262srt:MinimumMember2022-03-012022-11-30
0001616262srt:MaximumMember2022-03-012022-11-30
00016162622021-10-02
00016162622021-10-022021-10-02
0001616262rmcf:WarrantToPurchaseCommonStockMembersrt:MaximumMember2019-12-20
0001616262rmcf:WarrantToPurchaseCommonStockMember2019-12-20
0001616262rmcf:WarrantToPurchaseCommonStockMember2019-12-202019-12-20
0001616262rmcf:USwirlSegmentMember2022-02-28
0001616262us-gaap:OperatingSegmentsMemberrmcf:FranchisingMember2022-03-012023-02-28
0001616262us-gaap:OperatingSegmentsMemberrmcf:ManufacturingMember2022-03-012023-02-28
0001616262us-gaap:OperatingSegmentsMemberrmcf:RetailSegmentMember2022-03-012023-02-28
0001616262us-gaap:OperatingSegmentsMemberrmcf:USwirlSegmentMember2022-03-012023-02-28
0001616262us-gaap:OperatingSegmentsMemberus-gaap:AllOtherSegmentsMember2022-03-012023-02-28
0001616262us-gaap:IntersegmentEliminationMemberrmcf:FranchisingMember2022-03-012023-02-28
0001616262us-gaap:IntersegmentEliminationMemberrmcf:ManufacturingMember2022-03-012023-02-28
0001616262us-gaap:IntersegmentEliminationMemberrmcf:RetailSegmentMember2022-03-012023-02-28
0001616262us-gaap:IntersegmentEliminationMemberrmcf:USwirlSegmentMember2022-03-012023-02-28
0001616262us-gaap:IntersegmentEliminationMemberus-gaap:AllOtherSegmentsMember2022-03-012023-02-28
0001616262rmcf:FranchisingMember2022-03-012023-02-28
0001616262rmcf:ManufacturingMember2022-03-012023-02-28
0001616262rmcf:RetailSegmentMember2022-03-012023-02-28
0001616262rmcf:USwirlSegmentMember2022-03-012023-02-28
0001616262us-gaap:AllOtherSegmentsMember2022-03-012023-02-28
0001616262rmcf:FranchisingMember2023-02-28
0001616262rmcf:ManufacturingMember2023-02-28
0001616262rmcf:RetailSegmentMember2023-02-28
0001616262rmcf:USwirlSegmentMember2023-02-28
0001616262us-gaap:AllOtherSegmentsMember2023-02-28
0001616262us-gaap:OperatingSegmentsMemberrmcf:FranchisingMember2021-03-012022-02-28
0001616262us-gaap:OperatingSegmentsMemberrmcf:ManufacturingMember2021-03-012022-02-28
0001616262us-gaap:OperatingSegmentsMemberrmcf:RetailSegmentMember2021-03-012022-02-28
0001616262us-gaap:OperatingSegmentsMemberrmcf:USwirlSegmentMember2021-03-012022-02-28
0001616262us-gaap:OperatingSegmentsMemberus-gaap:AllOtherSegmentsMember2021-03-012022-02-28
0001616262us-gaap:IntersegmentEliminationMemberrmcf:FranchisingMember2021-03-012022-02-28
0001616262us-gaap:IntersegmentEliminationMemberrmcf:ManufacturingMember2021-03-012022-02-28
0001616262us-gaap:IntersegmentEliminationMemberrmcf:RetailSegmentMember2021-03-012022-02-28
0001616262us-gaap:IntersegmentEliminationMemberrmcf:USwirlSegmentMember2021-03-012022-02-28
0001616262us-gaap:IntersegmentEliminationMemberus-gaap:AllOtherSegmentsMember2021-03-012022-02-28
0001616262rmcf:FranchisingMember2021-03-012022-02-28
0001616262rmcf:ManufacturingMember2021-03-012022-02-28
0001616262rmcf:RetailSegmentMember2021-03-012022-02-28
0001616262rmcf:USwirlSegmentMember2021-03-012022-02-28
0001616262us-gaap:AllOtherSegmentsMember2021-03-012022-02-28
0001616262rmcf:FranchisingMember2022-02-28
0001616262rmcf:ManufacturingMember2022-02-28
0001616262rmcf:RetailSegmentMember2022-02-28
0001616262us-gaap:AllOtherSegmentsMember2022-02-28
0001616262us-gaap:OperatingSegmentsMemberrmcf:FranchisingMember2020-03-012021-02-28
0001616262us-gaap:OperatingSegmentsMemberrmcf:ManufacturingMember2020-03-012021-02-28
0001616262us-gaap:OperatingSegmentsMemberrmcf:RetailSegmentMember2020-03-012021-02-28
0001616262us-gaap:OperatingSegmentsMemberrmcf:USwirlSegmentMember2020-03-012021-02-28
0001616262us-gaap:OperatingSegmentsMemberus-gaap:AllOtherSegmentsMember2020-03-012021-02-28
0001616262us-gaap:IntersegmentEliminationMemberrmcf:FranchisingMember2020-03-012021-02-28
0001616262us-gaap:IntersegmentEliminationMemberrmcf:ManufacturingMember2020-03-012021-02-28
0001616262us-gaap:IntersegmentEliminationMemberrmcf:RetailSegmentMember2020-03-012021-02-28
0001616262us-gaap:IntersegmentEliminationMemberrmcf:USwirlSegmentMember2020-03-012021-02-28
0001616262us-gaap:IntersegmentEliminationMemberus-gaap:AllOtherSegmentsMember2020-03-012021-02-28
0001616262rmcf:FranchisingMember2020-03-012021-02-28
0001616262rmcf:ManufacturingMember2020-03-012021-02-28
0001616262rmcf:RetailSegmentMember2020-03-012021-02-28
0001616262rmcf:USwirlSegmentMember2020-03-012021-02-28
0001616262us-gaap:AllOtherSegmentsMember2020-03-012021-02-28
0001616262rmcf:FranchisingMember2021-02-28
0001616262rmcf:ManufacturingMember2021-02-28
0001616262rmcf:RetailSegmentMember2021-02-28
0001616262rmcf:USwirlSegmentMember2021-02-28
0001616262us-gaap:AllOtherSegmentsMember2021-02-28
00016162622022-03-012022-05-31
00016162622022-06-012022-08-31
00016162622022-09-012022-11-30
00016162622022-12-012023-02-28
00016162622021-03-012021-05-31
00016162622021-06-012021-08-31
00016162622021-09-012021-11-30
00016162622021-12-012022-02-28
0001616262rmcf:LossOnDistributionOfAssetsMember2022-03-012023-02-28
0001616262rmcf:LossOnDistributionOfAssetsMember2021-03-012022-02-28
0001616262rmcf:LossOnDistributionOfAssetsMember2020-03-012021-02-28
0001616262rmcf:ContestedSolicitationOfProxiesMember2022-03-012023-02-28
0001616262rmcf:ContestedSolicitationOfProxiesMember2021-03-012022-02-28
0001616262rmcf:ContestedSolicitationOfProxiesMember2020-03-012021-02-28
0001616262us-gaap:RestrictedStockUnitsRSUMemberrmcf:PresidentAndChiefExecutiveOfficerMemberrmcf:LetterAgreementMember2022-03-012023-02-28
0001616262us-gaap:RestrictedStockUnitsRSUMemberrmcf:PresidentAndChiefExecutiveOfficerMemberrmcf:LetterAgreementMember2021-11-032021-11-03
0001616262rmcf:PresidentAndChiefExecutiveOfficerMemberrmcf:LetterAgreementMember2022-03-012023-02-28
0001616262rmcf:PresidentAndChiefExecutiveOfficerMemberrmcf:LetterAgreementMember2021-03-012022-02-28
0001616262us-gaap:RestrictedStockUnitsRSUMemberrmcf:PresidentAndChiefExecutiveOfficerMemberrmcf:LetterAgreementMember2021-03-012022-02-28
0001616262rmcf:USwirlIncMember2022-03-012023-02-28
0001616262rmcf:USwirlIncMember2021-03-012022-02-28
0001616262rmcf:USwirlIncMember2020-03-012021-02-28
0001616262rmcf:USwirlIncMember2023-02-28
0001616262rmcf:USwirlIncMember2022-02-28
Table of Contents
UNITED STATES
SECURITIES AND EXCHANGE COMMISSION
WASHINGTON, D.C. 20549
FORM 10-K
(Mark One)
☒ ANNUAL REPORT PURSUANT TO SECTION 13 OR 15(d) OF THE SECURITIES EXCHANGE ACT OF 1934
For the fiscal year ended February 28, 2023
OR
☐ TRANSITION REPORT PURSUANT TO SECTION 13 OR 15(d) OF THE SECURITIES EXCHANGE ACT OF 1934
For the transition period from __________ to __________
Commission file number: 001-36865

Rocky Mountain Chocolate Factory, Inc.
(Exact name of registrant as specified in its charter)
| Delaware | 47-1535633 |
| (State or Other Jurisdiction of Incorporation or Organization) | (I.R.S. Employer Identification No.) |
265 Turner Drive
Durango, CO 81303
(Address of principal executive offices, including ZIP code)
(970) 259-0554
(Registrant’s telephone number, including area code)
Securities Registered Pursuant To Section 12(b) Of The Act:
| Title of each class | | Trading
Symbol(s) | | Name of each exchange on which registered |
| Common Stock, $0.001 par value per share | | RMCF | | The Nasdaq Global Market |
Securities Registered Pursuant To Section 12(g) Of The Act: None
Indicate by check mark if the registrant is a well-known seasoned issuer, as defined in Rule 405 of the Securities Act. Yes ☐ No ☒
Indicate by check mark if the registrant is not required to file reports pursuant to Section 13 or Section 15(d) of the Act. Yes ☐ No ☒
Indicate by check mark whether the registrant (1) has filed all reports required to be filed by Section 13 or 15(d) of the Securities Exchange Act of 1934 during the preceding 12 months (or for such shorter period that the registrant was required to file such reports), and (2) has been subject to such filing requirements for the past 90 days. Yes ☒ No ☐
Indicate by check mark whether the registrant has submitted electronically every Interactive Data File required to be submitted pursuant to Rule 405 of Regulation S-T (§ 232.405 of this chapter) during the preceding 12 months (or for such shorter period that the registrant was required to submit such files). Yes ☒ No ☐
Indicate by check mark whether the registrant is a large accelerated filer, an accelerated filer, a non-accelerated filer, smaller reporting company, or an emerging growth company. See the definitions of “large accelerated filer,” “accelerated filer,” “smaller reporting company,” and “emerging growth company” in Rule 12b-2 of the Exchange Act. (Check one):
| Large accelerated filer | ☐ | Accelerated filer | ☐ |
| Non-accelerated filer | ☒ | Smaller reporting company | ☒ |
| | | Emerging growth company | ☐ |
If an emerging growth company, indicate by check mark if the registrant has elected not to use the extended transition period for complying with any new or revised financial accounting standards provided pursuant to Section 13(a) of the Exchange Act. ☐
Indicate by check mark whether the registrant has filed a report on and attestation to its management’s assessment of the effectiveness of its internal control over financial reporting under Section 404(b) of the Sarbanes-Oxley Act (15 U.S.C. 7262(b)) by the registered public accounting firm that prepared or issued its audit report. ☐
If securities are registered pursuant to Section 12(b) of the Act, indicate by check mark whether the financial statements of the registrant included in the filing reflect the correction of an error to previously issued financial statements. ☐
Indicate by check mark whether any of those error corrections are restatements that required a recovery analysis of incentive-based compensation received by any of the registrant’s executive officers during the relevant recovery period pursuant to §240.10D-1(b). ☐
Indicate by check mark whether the registrant is a shell company (as defined in Rule 12b-2 of the Act). Yes ☐ No ☒
The aggregate market value of the registrant’s common stock (based on the closing price as quoted on the Nasdaq Global Market on August 31, 2022, the last business day of the registrant’s most recently completed second fiscal quarter) held by non-affiliates was $36,755,278. For purposes of this calculation, shares of common stock beneficially owned by each executive officer and director and by holders of more than 10% of the registrant’s outstanding common stock have been excluded since those persons may under certain circumstances be deemed to be affiliates of the registrant. This determination of affiliate status is not necessarily a conclusive determination for other purposes.
As of May 19, 2023, there were 6,283,450 shares of the registrant’s common stock outstanding.
DOCUMENTS INCORPORATED BY REFERENCE
Portions of the registrant’s definitive proxy statement in connection with the 2023 Annual Meeting of Stockholders (the “Proxy Statement”) are incorporated by reference in Part III of this Annual Report on Form 10-K. The Proxy Statement will be filed with the Securities and Exchange Commission within 120 days of the registrant’s fiscal year ended February 28, 2023.
ROCKY MOUNTAIN CHOCOLATE FACTORY, INC.
FORM 10-K
TABLE OF CONTENTS
Cautionary Note Regarding Forward-Looking Statements
This Annual Report on Form 10-K (“Annual Report”) contains statements of our expectations, intentions, plans and beliefs that constitute “forward-looking statements” within the meaning of Section 27A of the Securities Act of 1933, as amended, and Section 21E of the Securities Exchange Act of 1934, as amended (the “Exchange Act”), and are intended to come within the safe harbor protection provided by those sections. All statements other than statements of historical fact are “forward-looking statements,” including, but not limited to, any projections of earnings, revenue or other financial items; any statements of the plans, strategies and objectives of management, including for future operations, or capital expenditures; any statements concerning proposed new products, services, or developments; any statements regarding future economic conditions or performance; any statements of belief or expectation; and any statements of assumptions underlying any of the foregoing or other future events. Forward-looking statements may include, among others, words such as “will,” “may,” “would,” “could,” “might,” “likely,” “objective,” “predict,” “project,” “drive,” “seek,” “aim,” “target,” “outlook,” “continue” “intend,” “believe,” “expect,” “anticipate,” “should,” “plan,” “estimate,” “potential,” or similar expressions. Forward-looking statements involve risks and uncertainties that could cause actual results to differ materially from those projected, anticipated, or implied. Although it is not possible to predict or identify all such risks and uncertainties, they include, but are not limited to, the factors discussed in Item 1A. “Risk Factors” of Part I of this Annual Report and as described elsewhere in this Annual Report. All forward-looking statements are expressly qualified in their entirety by these and other cautionary statements that we make from time to time in our other SEC filings and public communications. You should evaluate forward-looking statements in the context of these risks and uncertainties and are cautioned not to place undue reliance on such statements. Forward-looking statements in this Annual Report are made only as of the date hereof, and we undertake no obligation to update or revise any forward-looking statement except as may be required by law.
PART I.
ITEM 1. BUSINESS
Our Company
Rocky Mountain Chocolate Factory, Inc., a Delaware corporation, and its subsidiaries (collectively, the “Company,” “Rocky Mountain,” “we,” “us,” or “our”), including its operating subsidiary with the same name, Rocky Mountain Chocolate Factory, Inc., a Colorado corporation (“RMCF”), is an international franchisor, confectionery manufacturer and retail operator. Founded in 1981, we are headquartered in Durango, Colorado and manufacture an extensive line of premium chocolate candies and other confectionery products. Our revenues and profitability are derived principally from our franchised/licensed system of retail stores that feature chocolate and other confectionary products. We also sell our candy in select locations outside of our system of retail stores. As of February 28, 2023, there was one Company-owned, 111 licensee-owned and 157 franchised Rocky Mountain Chocolate Factory stores operating in 37 states, Panama, and the Philippines.
In fiscal year (“FY”) 2023, approximately half (50%) of the products sold at Rocky Mountain Chocolate Factory stores were prepared on premises. We believe that in-store preparation of products creates a special store ambiance, and the aroma and sight of products being made attracts foot traffic and assures customers that products are fresh.
Our principal competitive strengths lie in our brand name recognition, our reputation for the quality, variety and taste of our products, the ambiance of our stores, our expertise in the manufacture of chocolate candy products and the merchandising and marketing of confectionary products, and the control and training infrastructures we have implemented to ensure consistent customer service and execution of successful practices and techniques at our stores.
We believe our manufacturing expertise and reputation for quality has facilitated the sale of select products through specialty markets. We are currently selling our products in a select number of specialty markets, including wholesale, fundraising, corporate sales, mail order, private label and internet sales (collectively “Omni-channel”).
Our consolidated revenues in FY 2023 were primarily derived from three principal sources: (i) sales to franchisees and other third parties of chocolates and other confectionery products manufactured by us (77%-76%-80% in 2023, 2022 and 2021 respectively); (ii) sales at Company-owned stores of chocolates and other confectionery products (including products manufactured by us) (3%-4%-4%), and (iii) the collection of initial franchise, royalties and marketing fees from franchisees (20%-20%-16%). For FY 2023, nearly all of our revenues were derived from domestic sources, with less than 1% derived from international sources. As described below, the Company sold its frozen yogurt business subsequent to the end of FY 2023.
Sale of Frozen Yogurt Business
On May 1, 2023, subsequent to the end of fiscal year 2023, the Company completed the sale of substantially all of the assets of its wholly-owned subsidiary and frozen yogurt business, U-Swirl International, Inc. (“U-Swirl”). The aggregate sale price of U-Swirl was $2.75 million, consisting of (i) $1.75 million in cash and (ii) $1.0 million evidenced by a three-year secured promissory note. The business divestiture of the U-Swirl segment was preceded by a separate sale of the Company’s three owned U-Swirl locations on February 24, 2023. With the sale of our frozen yogurt segment on May 1, 2023, we continue to focus on our confectionery business to further enhance our competitive position and operating margin, simplify our business model, and deliver sustainable value to our stockholders. The consolidated financial statements present the historical financial results of the former U-Swirl segment as discontinued operations for all periods presented. See Note 20 of the Notes to Consolidated Financial Statements included in Item 8, “Financial Statements and Supplementary Data“, of this Annual Report for information on this divestiture.
Business Strategy
Our updated long term strategic objective is to build upon the solid market position of our brand and high-quality products to create a world-class experience for consumers of premium chocolate products, whether in premium confection stores operated by our franchisees or by us, or purchased from us through a variety of other channels. We intend to lead this effort through the delivery of an exceptional store experience and development of category leadership through innovation. To accomplish this objective, we will employ a business strategy that includes the elements set forth below.
Product Quality and Variety
We maintain the gourmet taste and quality of our chocolate candies by using the finest chocolate and other wholesome ingredients. We use our proprietary recipes, primarily developed by our master candy makers. A typical Rocky Mountain Chocolate Factory store offers up to 100 of our chocolate candies throughout the year and as many as 200, including many packaged candies, during the holiday seasons. Individual stores also offer numerous varieties of gourmet caramel apples as well as other products prepared in the store from Company recipes. We have enhanced our product development and innovation capabilities through the Company’s recent hiring of its first ever R&D Director.
Store Atmosphere and Ambiance
We seek to establish a fun, enjoyable and inviting atmosphere in each of our store locations. Unlike most other confectionery stores, each Rocky Mountain Chocolate Factory store prepares numerous products, including caramel apples, in the store. In-store preparation is designed to be both fun and entertaining for customers. We believe the in-store preparation and aroma of our products enhances the ambiance at Rocky Mountain Chocolate Factory stores, is fun and entertaining for our customers and conveys an image of freshness and homemade quality. The Company has been, and is committed to, deploying increased headquarter resources to our store network to further improve the store experience and enhance profitability, all while maintaining brand standards.
Site Selection
Careful selection of a new retail site is critical to the success of our stores. We consider many factors in identifying suitable sites, including tenant mix, visibility, attractiveness, accessibility, level of foot traffic and occupancy costs. Final site selection occurs only after our senior management has approved the site.
Increase Same Store Retail Sales at Existing Rocky Mountain Chocolate Factory Stores
We seek to increase profitability of our store system by increasing sales at existing store locations through a combination of offering the optimal product assortment to stores, improving order fulfillment, facilitating increased product availability to stores through streamlined logistics, and providing Company personnel to help franchised locations improve their sales and profitability. We recognize that a 10% system-wide increase in revenues from our existing store base would be the equivalent of opening 15 new stores.
Changes in system-wide domestic same store retail sales at Rocky Mountain Chocolate Factory locations are as follows:
| FY 2019 compared to FY 2018 |
|
|
1.0 |
% |
| FY 2020 compared to FY 2019 |
|
|
0.5 |
% |
| FY 2021 compared to FY 2020 |
|
|
(24.8 |
)% |
| FY 2022 compared to FY 2021 |
|
|
62.4 |
% |
| FY 2023 compared to FY 2022 |
|
|
0.5 |
% |
Same store sales declined during FY 2021 primarily as a result of nearly all of the franchise stores being directly and negatively impacted by public health measures taken in response to COVID-19, with nearly all locations experiencing reduced operations as a result of, among other things, modified business hours and store and mall closures. This decline was offset by a same store sales increase during FY 2022 when store operations resumed normal operations following the initial impacts of COVID-19.
We are working towards a full rebranding of our offerings, as well as a redesign of our stores, both of which, we believe, will improve the store experience and have a positive impact on same store sales.
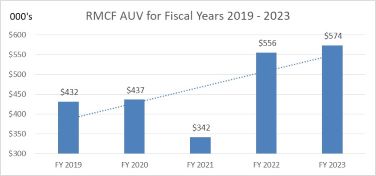
Increased System-Wide Annual Unit Volume (“AUV”)
A critical part of success in selling new franchises is the attractiveness of store level economics, which include robust and expanding system-wide annual sales. For FY 2023 our AUV was approximately $574,000, which represents a 31% increase from the FY 2020 AUV of $437,000. We look to build upon this momentum and our goal is to achieve system-wide AUV of $800,000 by fiscal year 2028.
Enhanced Operating Efficiencies
We have added highly experienced manufacturing and supply chain talent in order to bring sustained operating efficiencies to the factory. In addition to such actions and investing in new and more efficient factory equipment, we are rationalizing our portfolio of products and streamlining production lines to both reduce labor needs as well as improve product quality and consistency. We seek to achieve $1.2MM in annual operating cost improvements at our current level of production by the middle of fiscal year 2025, and achieve a 30% factory gross margin by fiscal year 2028.
Expansion Strategy
We are continually exploring opportunities to grow our brand and expand our business. Key elements of our expansion strategy are set forth below.
Unit Growth
We continue to pursue unit growth opportunities in locations where we have traditionally been successful, by improving and expanding our retail store concepts and product portfolio, and by targeting high pedestrian traffic environments.
High Traffic Environments
We currently establish franchised stores in the following environments: regional centers, outlet centers, tourist areas, street fronts, airports, other entertainment-oriented environments and festival and community centers. We have established business relationships with most of the major developers in the United States and believe that these relationships provide us with the opportunity to take advantage of attractive sites in new and existing real estate environments.
Multi-unit Operators
We have traditionally focused our franchise marketing efforts largely on single unit operators. By further enhancing our brand strength, product offering, and strong store experience, coupled with enhanced economics, we seek going forward to appeal more, and market to, multi-unit operators looking to expand their portfolio of franchised opportunities into a premium chocolate franchise concept.
Expanded Omni-channel Selling Efforts
We have acquired new sales and marketing talent, as well as developed new third party relationships, to facilitate the sale and distribution of Rocky Mountain Chocolate Factory products to channels outside of the franchisee network.
Rocky Mountain Chocolate Factory Name Recognition and New Market Penetration
We believe the visibility of our stores and the high foot traffic at many of our locations has generated strong name recognition of Rocky Mountain Chocolate Factory and demand for our franchises. The Rocky Mountain Chocolate Factory system currently is concentrated in the western and Rocky Mountain region of the United States, but growth has generated a gradual easterly momentum as new stores have been opened in the eastern half of the country. We believe this growth has further increased our name recognition and demand for our franchises. We believe that distribution of Rocky Mountain Chocolate Factory products through our Omni-channel business also increases name recognition and brand awareness in areas of the country in which we have not previously had a significant presence and we believe it will also improve and benefit our entire store system.
We seek to establish a fun, enjoyable and inviting atmosphere in each of our store locations. Unlike many other confectionery stores, each Rocky Mountain Chocolate Factory store prepares numerous products, including caramel apples, in the store. In FY 2023, an average of approximately half of the revenues of franchised stores were generated by sales of products prepared on premises. In-store preparation is designed to be both fun and entertaining for customers and we believe the in-store preparation and aroma of our products enhance the ambiance at Rocky Mountain Chocolate Factory stores, is fun and entertaining for our customers and conveys an image of freshness and homemade quality.
The average store size is approximately 1,000 square feet, approximately 650 square feet of which is selling space. Most stores are open seven days a week.
In January 2007, we began testing co-branded locations, such as the co-branded stores with Cold Stone Creamery. Co-branding a location is a vehicle to exploit retail environments that would not typically support a stand-alone Rocky Mountain Chocolate Factory store. Co-branding can also be used to more efficiently manage rent structure, payroll and other operating costs in environments that have not historically supported stand-alone Rocky Mountain Chocolate Factory stores. As of February 28, 2023, Cold Stone Creamery franchisees operated 101 co-branded locations, our U-Swirl franchisees operated 10 co-branded locations.
International units in operation were as follows on February 28, 2023:
| Rocky Mountain Chocolate Factory |
|
|
|
|
| The Republic of Panama |
|
|
1 |
|
| The Republic of the Philippines |
|
|
3 |
|
| Total |
|
|
4 |
|
Products and Packaging
We produce approximately 400 chocolate candies and other confectionery products using proprietary recipes developed primarily by our master candy makers. These products include many varieties of clusters, caramels, creams, toffees, mints and truffles. These products are offered for sale and also configured into approximately 250 varieties of packaged assortments. During the Christmas, Easter and Valentine's Day holiday seasons, we may make as many as 90 items, including many candies offered in packages, that are specially designed for such holidays. A typical Rocky Mountain Chocolate Factory store offers up to 100 of these approximately 400 chocolate candies and other confectionery products throughout the year and up to an additional 90 during the holiday seasons. Individual stores also offer more than 15 varieties of caramel apples and other products prepared in the store. In FY 2023, approximately 49% of the revenues of Rocky Mountain Chocolate Factory stores are generated by products manufactured at our factory, 48% by products made in individual stores using our recipes and ingredients purchased from us or approved suppliers and the remaining 3% by products such as ice cream, coffee and other sundries purchased from approved suppliers.
In FY 2023, approximately 15% of our factory sales resulted from the sale of products outside of our system of franchised and licensed locations, which we refer to as Omni-channel customers, compared with 17% of our factory sales resulting from Omni-channel customers in FY 2022. See Item 1A “Risk Factors—Risks Related to Our Company and Strategy—Our Sales to Omni-channel Customers, Customers Outside Our System of Franchised Stores, Are Concentrated Among a Small Number of Customers.” These products are produced using the same quality ingredients and manufacturing processes as the products sold in our network of retail stores.
We use the finest chocolates, nutmeats and other wholesome ingredients in our candies and continually strive to offer new confectionery items in order to maintain the excitement and appeal of our products. We develop special packaging for the Christmas, Valentine's Day and Easter holidays, and customers can have their purchases packaged in decorative boxes and fancy tins throughout the year.
Chocolate candies that we manufacture are sold at prices ranging from $21.95 to $33.30 per pound, with an average price of $26.96 per pound. Franchisees set their own retail prices, though we do recommend prices for all of our products.
Operating Environment
Rocky Mountain Chocolate Factory
We currently establish Rocky Mountain Chocolate Factory stores in six primary environments: outlet centers, festival and community centers, regional centers, tourist areas, street fronts, airports and other entertainment-oriented shopping centers. Each of these environments has a number of attractive features, including high levels of foot traffic. Rocky Mountain Chocolate Factory domestic franchise locations in operation as of February 28, 2023, include:
| Outlet Centers |
|
|
20.9 |
% |
| Festival/Community Centers |
|
|
20.3 |
% |
| Regional Centers |
|
|
18.9 |
% |
| Tourist Areas |
|
|
17.6 |
% |
| Street Fronts |
|
|
10.5 |
% |
| Airports |
|
|
5.9 |
% |
| Other |
|
|
5.9 |
% |
Outlet Centers
As of February 28, 2023, there were approximately 32 Rocky Mountain Chocolate Factory stores in outlet centers. We have established business relationships with a number of the major outlet center developers in the United States. Although not all factory outlet centers provide desirable locations for our stores, we believe our relationships with these developers will provide us with the opportunity to take advantage of attractive sites in new and existing outlet centers.
Festival and Community Centers
As of February 28, 2023, there were approximately 31 Rocky Mountain Chocolate Factory stores in festival and community centers. Festival and community centers offer retail shopping outside of traditional regional and outlet center shopping.
Regional Centers
As of February 28, 2023, there were Rocky Mountain Chocolate Factory stores in approximately 29 regional centers, including a location in the Mall of America in Bloomington, Minnesota. Although they often provide favorable levels of foot traffic, regional centers typically involve more expensive rent structures and competing food and beverage concepts.
Tourist Areas, Street Fronts, Airports and Other Entertainment-Oriented Shopping Centers
As of February 28, 2023, there were approximately 27 Rocky Mountain Chocolate Factory stores in locations considered to be tourist areas. Tourist areas are very attractive locations because they offer high levels of foot traffic and favorable customer spending characteristics, and greatly increase our visibility and name recognition. We believe there are a number of other environments that have the characteristics necessary for the successful operation of Rocky Mountain Chocolate Factory stores such as airports and casinos. As of February 28, 2023, there were 9 franchised Rocky Mountain Chocolate Factory stores at airport locations.
Franchising Program
General
We continue to attract qualified and experienced franchisees, whom we consider to be a vital part of the Company’s continued growth. We believe our relationship with our franchisees is fundamental to the performance of our brand and we strive to maintain a collaborative relationship with our franchisees. Our franchising philosophy is one of service and commitment to our franchise system and we continuously seek to improve our franchise support services. Our concept has been rated as an outstanding franchise opportunity by publications and organizations rating such opportunities. The Rocky Mountain Chocolate Factory concept has frequently been ranked in the Top 500 Franchises by Entrepreneur Magazine. As of February 28, 2023, there were 157 franchised stores in the Rocky Mountain Chocolate Factory system.
Franchisee Sourcing and Selection
The majority of new franchises are awarded to persons referred to us by existing franchisees, to interested consumers who have visited one of our domestic franchise locations and to existing franchisees. We also advertise for new franchisees in national and regional newspapers and online as suitable potential store locations come to our attention. We are exploring the use of third party franchise lead generators to supplement our efforts. Franchisees are currently approved by a committee of the senior executive team based on the applicant's net worth and liquidity, business acumen and prior experience with franchising and/or fast moving consumer goods (“FMCG”), together with an assessment of work ethic and personality compatibility with our operating philosophy.
International Franchising and Licensing
International growth is generally achieved through entry into a Master License Agreement covering specific countries, with a licensee that meets minimum qualifications to develop Rocky Mountain Chocolate Factory in that country. License agreements are generally entered into for a period of 3-10 years and allow the licensee exclusive development rights in a country. Generally, we require an initial license fee and commitment to a development schedule. Active international license agreements in place include the following:
| |
● |
In October 2014, we entered into a Licensing Agreement in the Republic of the Philippines. As of February 28, 2023, three units were operating under the agreement. |
| |
● |
In May 2017, we entered into a Licensing Agreement in the Republic of Panama. As of February 28, 2023, one unit was operating under the agreement. |
Co-Branding
In August 2009, we entered into a Master License Agreement with Kahala Franchise Corp. Under the terms of the agreement, select current and future Cold Stone Creamery franchise stores are co-branded with both the Rocky Mountain Chocolate Factory and the Cold Stone Creamery brands. Locations developed or modified under the agreement are subject to the approval of both parties. Locations developed or modified under the agreement will remain franchisees of Cold Stone Creamery and will be licensed to offer the Rocky Mountain Chocolate Factory brand. As of February 28, 2023, Cold Stone Creamery franchisees operated 101 stores under this agreement.
Additionally, we allow U-Swirl brands to offer Rocky Mountain Chocolate Factory products under terms similar to other co-branding agreements. As of February 28, 2023, there were 10 U-Swirl cafés offering Rocky Mountain Chocolate Factory products.
Training and Support
Each domestic franchisee owner/operator and each store manager for a domestic franchisee is required to complete a comprehensive training program in store operations and management. We have established a training center at our Durango headquarters in the form of a full-sized replica of a properly configured and merchandised Rocky Mountain Chocolate Factory store. Topics covered in the training course include our philosophy of store operation and management, customer service, merchandising, pricing, cooking, inventory and cost control, quality standards, record keeping, labor scheduling and personnel management. Training is based on standard operating policies and procedures contained in an operations manual provided to all franchisees, which the franchisee is required to follow by terms of the franchise agreement. Additionally, and importantly, trainees are provided with a complete orientation to our operations by working in key factory operational areas and by meeting with members of our senior management.
Our operating objectives include providing knowledge and expertise in merchandising, marketing and customer service to all front-line store level employees to maximize their skills and ensure that they are fully versed in our proven techniques.
We provide ongoing support to franchisees through our field consultants, who maintain regular and frequent communication with the stores by phone and by site visits. The field consultants also review and discuss store operating results with the franchisee and provide advice and guidance in improving store profitability and in developing and executing store marketing and merchandising programs.
Quality Standards and Control
The franchise agreements for Rocky Mountain Chocolate Factory brand franchisees require compliance with our procedures of operation and food quality specifications and permit audits and inspections by us.
Operating standards for Rocky Mountain Chocolate Factory brand stores are set forth in operating manuals. These manuals cover general operations, factory ordering, merchandising, advertising and accounting procedures. Through their regular visits to franchised stores, our field consultants audit performance and adherence to our standards. We have the right to terminate any franchise agreement for non‑compliance with our operating standards. Products sold at the stores and ingredients used in the preparation of products approved for on-site preparation must be purchased from us or from approved suppliers.
The Franchise Agreement: Terms and Conditions
The domestic offer and sales of our franchise concepts are made pursuant to the respective franchise disclosure document prepared in accordance with federal and state laws and regulations. States that regulate the sale and operation of franchises require a franchisor to register or file certain notices with the state authorities prior to offering and selling franchises in those states.
Under the current form of our domestic franchise agreements, franchisees pay us (i) an initial franchise fee for each store, (ii) royalties based on monthly gross sales, and (iii) a marketing fee based on monthly gross sales. Franchisees are generally granted exclusive territory with respect to the operation of their stores only in the immediate vicinity of their stores. Chocolate products not made on premises by franchisees must be purchased from us or approved suppliers. The franchise agreements require franchisees to comply with our procedures of operation and food quality specifications, to permit inspections and audits by us and to remodel stores to conform with standards then in effect. We may terminate the franchise agreement upon the failure of the franchisee to comply with the conditions of the agreement and upon the occurrence of certain events, such as insolvency or bankruptcy of the franchisee or the commission by the franchisee of any unlawful or deceptive practice, which in our judgment is likely to adversely affect the system. Our ability to terminate franchise agreements pursuant to such provisions is subject to applicable bankruptcy and state laws and regulations. See “Regulation” below for additional information.
The agreements prohibit the transfer or assignment of any interest in a franchise without our prior written consent. The agreements also give us a right of first refusal to purchase any interest in a franchise if a proposed transfer would result in a change of control of that franchise. The refusal right, if exercised, would allow us to purchase the interest proposed to be transferred under the same terms and conditions and for the same price as offered by the proposed transferee.
The term of each franchise agreement is ten years, and franchisees have the right to renew for one additional ten-year term.
Franchise Financing
We do not typically provide prospective franchisees with financing for their stores for new or existing franchises, but we have developed relationships with several sources of franchisee financing to whom we will refer franchisees. Typically, franchisees have obtained their own sources of such financing and have not required our assistance. In the normal course of business, we extend credit to customers, primarily franchisees that satisfy pre-defined credit criteria, for inventory and other operational costs.
In select instances, we have provided limited financing to franchisees. As a result, as of February 28, 2023, we have approximately $200,000 of notes receivable as a result of financing our franchisees. When we finance franchisees the notes are secured by the assets financed.
Company Store Operations
As of February 28, 2023, there was one Company-owned Rocky Mountain Chocolate Factory store. Our flagship store, located in Durango, Colorado, (“Flagship Store”) provides a training ground for Company personnel and a controllable testing ground for new products and promotions, operating and training methods and merchandising techniques, which may then be incorporated into the franchise store operations.
Manufacturing Operations
General
We manufacture our chocolate candies at our manufacturing facility in Durango, Colorado. All products are produced consistent with our philosophy of using the finest high-quality ingredients to achieve our marketing motto of “The Peak of Perfection in Handmade Chocolates®.”
We have always believed that we should control the manufacturing of our own chocolate products. By controlling manufacturing, we can better maintain our high product quality standards, offer unique proprietary products, manage costs, control production and shipment schedules and potentially pursue new or under-utilized distribution channels.
Manufacturing Processes
The manufacturing process primarily involves cooking or preparing candy centers, including nuts, caramel, peanut butter, creams and jellies, and then coating them with chocolate or other toppings. All of these processes are conducted in carefully controlled temperature ranges, and we employ strict quality control procedures at every stage of the manufacturing process. We use a combination of manual and automated processes at our factory. Although we believe that it is currently preferable to perform certain manufacturing processes, such as the dipping of some large pieces by hand, automation increases the speed and efficiency of the manufacturing process. We have from time to time automated certain processes formerly performed by hand where it has become cost-effective for us to do so without compromising product quality or appearance.
We also seek to ensure the freshness of products sold in Rocky Mountain Chocolate Factory stores with frequent shipments. Most Rocky Mountain Chocolate Factory stores do not have significant space for the storage of inventory, and we encourage franchisees and store managers to order only the quantities that they can reasonably expect to sell within approximately two to four weeks. For these reasons, we generally do not have a significant backlog of orders.
The manufacture and sale of consumer food products is highly regulated. In the U.S., our activities are subject to regulation by various government agencies, including the Food and Drug Administration (“FDA”), the Department of Agriculture, the Federal Trade Commission, the Department of Commerce and the Environmental Protection Agency, as well as various state and local agencies. Similar agencies also regulate our businesses outside of the U.S.
The Company has a product quality and safety program. This program is integral to our supply chain platform and is intended to ensure that all products we purchase, manufacture and distribute are safe, are of high quality and comply with applicable laws and regulations. Through our product quality and safety program, we evaluate our supply chain including ingredients, packaging, processes, products, distribution and the environment to determine where product quality and safety controls are necessary. We follow the FDA mandated Hazard Analysis and Risk-based Preventive Controls which includes a 12 step process to determine risks based on individual processes. To support this hazard analysis model, and in accordance with private and federal mandated requirements, we also adhere to all good manufacturing practices ("GMPs") including several supporting policies and procedures that ensure all risks identified are in control. Various government agencies and third-party firms, as well as our quality assurance staff, conduct audits of all facilities that manufacture our products to ensure effectiveness and compliance with our program and applicable laws and regulations.
Ingredients
The principal ingredients used in our products are chocolate, nuts, sugar, corn syrup, cream and butter. The factory receives shipments of ingredients daily. To ensure the consistency of our products, we buy ingredients from a limited number of reliable suppliers. In order to ensure a continuous supply of chocolate and certain nuts, we frequently enter into purchase contracts of between six to eighteen months for these products. Because prices for these products may fluctuate, we may benefit if prices rise during the terms of these contracts, but we may be required to pay above-market prices if prices fall. We have one or more alternative sources for most essential ingredients and therefore believe that the loss of any one supplier would not have a material adverse effect on our business or results of operations. We currently purchase small amounts of finished candy from third parties on a private label basis for sale in Rocky Mountain Chocolate Factory stores. As a result of recent macro-economic inflationary trends and disruptions to the global supply chain, we have experienced and may continue to experience higher raw material, labor, and freight costs.
Trucking Operations
We operate eight trucks and ship a substantial portion of our products from the factory on our own fleet. Our trucking operations enable us to deliver our products to the stores quickly and cost-effectively. In addition, we back-haul our own ingredients and supplies, as well as products from third parties, on return trips, which helps achieve even greater efficiencies and cost savings.
Marketing
General
We rely primarily on in-store promotion and point-of-purchase materials to promote the sale of our products. The monthly marketing fees collected from franchisees are used by us to develop new packaging and in-store promotion and point-of-purchase materials, and to create and update our local store marketing guides and materials.
We focus on local store marketing efforts by providing customizable marketing materials, including advertisements, coupons, flyers and brochures generated by our in-house Creative Services department. The department works directly with franchisees to implement local store marketing programs.
We have not historically, and do not intend to, engage in national traditional media advertising in the near future. Consistent with our commitment to community support, we seek opportunities to participate in local and regional events, sponsorships and charitable causes. This support leverages low-cost, high return publicity opportunities for mutual gain partnerships.
Internet and Social Media
We’ve initiated a robust program to leverage the marketing benefits of various social media outlets. These lower-cost marketing opportunities leverage the positive feedback of our customers, expanding brand awareness through a customer’s network of contacts. Complementary to local store marketing efforts, these networks also provide a medium for us to communicate regularly and authentically with customers. When possible, we work to facilitate direct relationships between our franchisees and their customers. We use social media as a tool to build brand recognition, increase repeat exposure, and enhance dialogue with consumers about their preferences and needs. The majority of stores have location-specific Facebook® and Instagram® accounts dedicated to helping customers interact directly with their local store. Proceeds from the monthly marketing fees collected from franchisees are used by us to facilitate and assist stores in managing their online presence consistent with our brand and marketing efforts.
Competition
The retailing of confectionery products is highly competitive. We and our franchisees compete with numerous businesses that offer products similar to those offered by our stores. Many of these competitors have greater name recognition and financial, marketing and other resources than us. In addition, there is intense competition among retailers for attractive commercial real estate sites suitable for Rocky Mountain Chocolate Factory stores, store personnel and qualified franchisees.
We believe that our principal competitive strengths lie in our name recognition and our reputation for the quality, value, variety and taste of our products and the ambiance of our stores; our knowledge and experience in applying criteria for the selection of new store locations; our expertise in merchandising and marketing of chocolate and other candy products; and the control and training infrastructures we have implemented to ensure execution of successful practices and techniques at our store locations. In addition, by controlling the manufacturing of our own chocolate products, we can better maintain our high product quality standards for those products, offer proprietary products, manage costs, control production and shipment schedules and pursue new or under-utilized distribution channels.
Trade Name and Trademarks
The trade name “Rocky Mountain Chocolate Factory®,” the phrases, “The Peak of Perfection in Handmade Chocolates®“, “America's Chocolatier®“ as well as all other trademarks, service marks, symbols, slogans, emblems, logos and designs used in the Rocky Mountain Chocolate Factory system, are our proprietary rights. We believe all of the foregoing are of material importance to our business. The trademark “Rocky Mountain Chocolate Factory” is registered in the United States and Canada. Applications to register the Rocky Mountain Chocolate Factory trademark have been filed and/or obtained in certain foreign countries.
We have not attempted to obtain patent protection for the proprietary recipes developed by our master candy-maker and instead rely upon our ability to maintain the confidentiality of those recipes.
Environmental Matters
We are not aware of any federal, state, local or international environmental laws or regulations that we expect to materially affect our earnings or competitive position or result in material capital expenditures. However, we cannot predict the effect of possible future environmental legislation or regulations on our operations. During FY 2023, we had no material environmental compliance-related capital expenditures, and no such material expenditures are anticipated in FY 2024.
Seasonal Factors
Our sales and earnings are seasonal, with significantly higher sales and earnings occurring during key holidays, such as Christmas, Easter and Valentine's Day, and the U.S. summer vacation season than at other times of the year, which may cause fluctuations in our quarterly results of operations. In addition, quarterly results have been, and in the future are likely to be, affected by the timing of new store openings, the sale of franchises and the timing of purchases by customers outside our network of franchised locations. Because of the seasonality of our business, results for any quarter are not necessarily indicative of the results that may be achieved in other quarters or for a full fiscal year.
Regulation
Company-owned and franchised Rocky Mountain Chocolate Factory stores are subject to licensing and regulation by the health, sanitation, safety, building and fire agencies in the state or municipality where located. Difficulties or failures in obtaining the required licensing or approvals could delay or prevent the opening of new stores. New stores must also comply with landlord and developer criteria.
Many states have laws regulating franchise operations, including registration and disclosure requirements in the offer and sale of franchises. We are also subject to the Federal Trade Commission regulations relating to disclosure requirements in the sale of franchises and ongoing disclosure obligations.
Additionally, certain states have enacted and others may enact laws and regulations governing the termination or non-renewal of franchises and other aspects of the franchise relationship that are intended to protect franchisees, including among other things, limitation on the duration and scope of non-competition provisions applicable to franchisees. Although these laws and regulations, and related court decisions, may limit our ability to terminate franchises and alter franchise agreements, we do not believe that such laws or decisions will have a material adverse effect on our franchise operations. However, the laws applicable to franchise operations and relationships continue to develop, and we are unable to predict the effect on our intended operations of additional requirements or restrictions that may be enacted or of court decisions that may be adverse to franchisors.
Federal and state environmental regulations have not had a material impact on our operations but more stringent and varied requirements of local governmental bodies with respect to zoning, land use and environmental factors could delay the construction of new stores, increase our capital expenditures and thereby decrease our earnings and negatively impact our competitive position.
Companies engaged in the manufacturing, packaging and distribution of food products are subject to extensive regulation by various governmental agencies. A finding of failure to comply with one or more regulations could result in the imposition of sanctions, including the closing of all or a portion of our facilities for an indeterminate period of time. Our product labeling is subject to and complies with the Nutrition Labeling and Education Act of 1990 and the Food Allergen Labeling and Consumer Protection Act of 2004.
We provide a limited amount of trucking services to third parties, to fill available space on our trucks. Our trucking operations are subject to various federal and state regulations, including regulations of the Federal Highway Administration and other federal and state agencies applicable to motor carriers, safety requirements of the Department of Transportation relating to interstate transportation and federal, state and Canadian provincial regulations governing matters such as vehicle weight and dimensions.
We believe that we are operating in substantial compliance with all applicable laws and regulations.
Human Capital
On February 28, 2023, we employed approximately 158 people, including 136 full-time employees, in the United States. Most employees, with the exception of store management, factory management and corporate management, are paid on an hourly basis. We also employ some individuals on a temporary basis during peak periods of store and factory operations. We seek to ensure that participatory management processes, mutual respect and professionalism and high-performance expectations for the employees exist throughout the organization. We believe that we provide working conditions, wages and benefits that compare favorably with those of our competitors. Our employees are not covered by a collective bargaining agreement. We consider our employee relations to be good.
The Company’s franchisees are independent business owners, their employees are not the Company’s employees and therefore are not included in our employee count.
Labor and Supply Chain
As a result of recent macroeconomic inflationary trends and disruptions to the global supply chain, we have experienced and expect to continue experiencing higher raw material, labor, and freight costs. We have seen labor and logistics challenges, which we believe have contributed to lower factory, retail, and e-commerce sales of our products due to the availability of material, labor, and freight. In addition, we could experience additional lost sales opportunities if our products are not available for purchase as a result of continued disruptions in our supply chain relating to an inability to obtain ingredients or packaging, labor challenges at our logistics providers or our manufacturing facility, or if we or our franchisees experience delays in stocking our products. For additional information, see Item 1A. “Risk Factors” - The Availability and Price of Principal Ingredients Used in Our Products Are Subject to Factors Beyond Our Control.“Item 7. Management’s Discussion and Analysis of Financial Condition and Results of Operations” for a discussion of recent business developments.
Our principal executive offices are located at 265 Turner Drive, Durango, Colorado 81303, and our telephone number is (970) 259-0554. We have operations throughout the Unites Stated, Panama and the Philippines. Our website address is www.rmcf.com. Information contained on or accessible through our websites is neither a part of this Annual Report nor incorporated by reference herein.
Ethics and Governance
We have adopted the Rocky Mountain Chocolate Factory Code of Conduct, which qualifies as a code of ethics under Item 406 of Regulation S-K. The code applies to all of our employees, officers, including our principal executive officer, principal financial officer, principal accounting officer or controller, and persons performing similar functions, and directors. Our Code of Conduct is available free of charge on our website at https://ir.rmcf.com/corporate-governance/governance-documents. We will disclose any waiver we grant to an executive officer or director under our code of ethics, or certain amendments to the Code of Conduct, on our website.
In addition, we have adopted Code of Ethics for Senior Financial Officers, charters for each of the Board’s four standing committees and the Whistleblower/Complaint Procedures for Accounting and Auditing Matters. All of these materials are available on our web site at https://ir.rmcf.com/corporate-governance/governance-documents.
Available Information
The Internet address of our website is www.rmcf.com. Additional websites specific to our franchise opportunities and investor relations are www.sweetfranchise.com and https://ir.rmcf.com, respectively.
We file or furnish annual, quarterly and current reports, proxy statements and other information with the United States Securities and Exchange Commission (“SEC”). We make available free of charge, through our Internet website, our Annual Report, Quarterly Reports on Form 10-Q, Current Reports on Form 8-K, and amendments to those reports filed or furnished pursuant to Section 13(a) or 15(d) of the Exchange Act, as soon as reasonably practicable after we electronically file such material with, or furnish it to, the SEC. The SEC also maintains a website that contains these reports, proxy and information statements and other information that can be accessed, free of charge, at www.sec.gov. The contents of our websites are not incorporated into, and should not be considered a part of, this Annual Report.
ITEM 1A. RISK FACTORS
Risks Specific to Our Company and the Industry in Which We Operate
Our Sales To Omni-Channel Customers, Customers Outside Our System Of Franchised Stores, Are Concentrated Among A Small Number Of Customers.
The Company has historically sold its product to relatively few customers outside its network of franchised and licensed locations (Omni-channel customers).
During FY 2023 our sales to Omni-channel customers were approximately $3.5 million or 11.5% of our total revenue. Of this amount, approximately 77% or $2.7 million was the result of sales to three customers.
The Divestiture Of Our U-Swirl Business May Have Material Adverse Effects On Our Financial Condition, Results Of Operations Or Cash Flows.
In May 2023, subsequent to our fiscal year-end, we announced that we had completed the sale of substantially all of the assets of U-Swirl, our wholly-owned subsidiary and frozen yogurt business. The consummation of the sale of the U-Swirl business involves risks, including retention of uncertain contingent liabilities related to the divested business and risks associated with the collection of notes receivable contemplated in the sale, any of which could result in a material adverse effect to our financial condition, results of operations or cash flows. We cannot be certain that we will be successful in managing these or any other significant risks that we encounter as a result of divesting the U-Swirl business.
Our Growth Is Dependent Upon Attracting And Retaining Qualified Franchisees And Their Ability To Operate Their Franchised Stores Successfully.
Our continued growth and success are dependent in part upon our ability to attract, retain and contract with qualified franchisees. Our growth is dependent upon the ability of franchisees to operate their stores successfully, promote and develop our store concepts, and maintain our reputation for an enjoyable in-store experience and high-quality products. Although we have established criteria to evaluate prospective franchisees and have been successful in attracting franchisees, there can be no assurance that franchisees will be able to operate successfully in their franchise areas in a manner consistent with our concepts and standards. As a result, we may realize a reduction in number of units in operation or fail to achieve our opening targets.
Increases In Costs Could Adversely Affect Our Operations.
Inflationary factors such as increases in the costs of ingredients, energy and labor directly affect our operations. Most of our leases provide for cost-of-living adjustments and require us to pay taxes, insurance and maintenance expenses, all of which are subject to inflation. Additionally, our future lease costs for new facilities may reflect potentially escalating costs of real estate and construction. There is no assurance that we will be able to pass on our increased costs to our customers or that our customers will continue to purchase at historical levels in the event that we pass along cost increases in the form of higher prices. If we are unable to pass along cost increases we may realize a decrease in gross margin on products we sell and produce.
Price Increases May Not Be Sufficient To Offset Cost Increases And Maintain Profitability Or May Result In Sales Volume Declines Associated With Pricing Elasticity.
We may be able to pass some or all raw materials, energy and other input cost increases to customers by increasing the selling prices of our products, however, higher product prices may also result in a reduction in sales volume and/or consumption. If we are not able to increase our selling prices sufficiently, or in a timely manner, to offset increased raw material, energy or other input costs, including packaging, direct labor, overhead and employee benefits, or if our sales volume decreases significantly, there could be a negative impact on our financial condition and results of operations.
Our Expansion Plans Are Dependent On The Availability Of Suitable Sites For Franchised Stores At Reasonable Occupancy Costs.
Our expansion plans are critically dependent on our ability to obtain suitable sites for franchised stores at reasonable occupancy costs for our franchised stores in high foot traffic retail environments. There is no assurance that we will be able to obtain suitable locations for our franchised stores in this environment at a cost that will allow such stores to be economically viable.
Same Store Sales Have Fluctuated and Will Continue to Fluctuate on a Regular Basis.
Our same store sales, defined as year-over-year sales for a store that has been open for at least one year, have fluctuated significantly in the past on an annual and quarterly basis and are expected to continue to fluctuate in the future. During the past five fiscal years, same store sales results at Rocky Mountain Chocolate Factory franchise stores have fluctuated as follows: (a) from (24.8%) to 62.4% for annual fiscal year comparisons; and (b) from (29.3%) to 58.5% for quarterly comparisons. Sustained declines in same store sales or significant same store sales declines in any single period could have a material adverse effect on our results of operations. Same store sales declined during FY 2021 and established the large negative percentage changes reflected above, primarily as a result of nearly all of the franchise stores being directly and negatively impacted by public health measures taken in response to COVID-19, with nearly all locations experiencing reduced operations as a result of, among other things, modified business hours and store and mall closures. Same store sales increased during FY 2022 and established the large positive percentage changes reflected above, primarily as a result of nearly all of the franchise stores being directly and positively impacted by a resurgence in consumer demand following the relaxing of many public health measures taken in response to COVID-19. If same store sales decline, we may experience a decrease in demand for products we sell and a decrease in revenue from royalty and marketing fees.
Higher Labor Costs, Increased Competition For Qualified Team Members And Ensuring Adequate Staffing Increases The Cost Of Doing Business. Additionally, Changes In Employment And Labor Laws, Including Health Care Legislation And Minimum Wage Increases, Could Increase Costs For Our System-Wide Operations.
Our success depends in part on our and our franchisees’ ability to recruit, motivate, train and retain a qualified workforce to work in our stores in an intensely competitive environment. We and our franchisees have experienced, and could continue to experience, a shortage of labor for stores positions due to job market trends and conditions, which could decrease the pool of available qualified talent for key functions. Our ability to attract and retain hourly employees in our stores and factory has been impacted by these trends and conditions, and we expect staffing and labor challenges to continue into 2024. Increased costs associated with recruiting, motivating and retaining qualified employees to work in the Company-owned stores, franchised stores and our factory have had, and may in the future have, a negative impact on our Company-owned store and factory margins and the margins of franchised stores. Competition for qualified drivers for both our stores and supply-chain function also continues to increase as more companies compete for drivers or enter the delivery space, including third party aggregators. Additionally, economic actions, such as boycotts, protests, work stoppages or campaigns by labor organizations, could adversely affect us (including our ability to recruit and retain talent) or our franchisees and suppliers. Social media may be used to foster negative perceptions of employment with our Company in particular or in our industry generally, and to promote strikes or boycotts.
We are also subject to federal, state and foreign laws governing such matters as minimum wage requirements, overtime compensation, benefits, working conditions, citizenship requirements and discrimination and family and medical leave and employee related litigation. Labor costs and labor-related benefits are primary components in the cost of operation. Labor shortages, increased employee turnover and health care mandates could increase our system-wide labor costs.
A significant number of hourly personnel are paid at rates at or above the federal and state minimum wage requirements. Accordingly, the enactment of additional state or local minimum wage increases above federal wage rates or regulations related to exempt employees has increased and could continue to increase labor costs for our domestic system-wide operations. A significant increase in the federal minimum wage requirement could adversely impact our financial condition and results of operations.
The Seasonality Of Our Sales And New Store Openings Can Have A Significant Impact On Our Financial Results From Quarter To Quarter.
Our sales and earnings are seasonal, with significantly higher sales and earnings occurring during key holidays and summer vacation season than at other times of the year, which causes fluctuations in our quarterly results of operations. In addition, quarterly results have been, and in the future are likely to be, affected by the timing of new store openings and the sale of franchises. Because of the seasonality of our business and the impact of new store openings and sales of franchises, results for any quarter are not necessarily indicative of the results that may be achieved in other quarters or for a full fiscal year.
The Retailing Of Confectionery Products Is Highly Competitive And Many Of Our Competitors Have Competitive Advantages Over Us.
The retailing of confectionery products is highly competitive. We and our franchisees compete with numerous businesses that offer similar products. Many of these competitors have greater name recognition and financial, marketing and other resources than we do. In addition, there is intense competition among retailers for real estate sites, store personnel and qualified franchisees. Competitive market conditions could have a material adverse effect on us and our results of operations and our ability to expand successfully.
Changes In Consumer Tastes And Trends Could Have A Material Adverse Effect On Our Operations.
The sale of our products is affected by changes in consumer tastes and health concerns, including views regarding the consumption of chocolate. Numerous other factors that we cannot control, such as economic conditions, demographic trends, traffic patterns and weather conditions, influence the sale of our products. Changes in any of these factors could have a material adverse effect on us and our results of operations.
We Are Subject To Federal, State And Local Regulations.
We are subject to regulation by the Federal Trade Commission and must comply with certain state laws governing the offer, sale and termination of franchises and the refusal to renew franchises. Many state laws also regulate substantive aspects of the franchisor-franchisee relationship by, for example, requiring the franchisor to deal with its franchisees in good faith, prohibiting interference with the right of free association among franchisees and regulating discrimination among franchisees in charges, royalties or fees. Franchise laws continue to develop and change, and changes in such laws could impose additional costs and burdens on franchisors. Our failure to obtain approvals to sell franchises and the adoption of new franchise laws, or changes in existing laws, could have a material adverse effect on us and our results of operations.
Each of our Company-owned and franchised stores is subject to licensing and regulation by the health, sanitation, safety, building and fire agencies in the state or municipality where located. Difficulties or failures in obtaining required licenses or approvals from such agencies could delay or prevent the opening of a new store. We and our franchisees are also subject to laws governing our relationships with employees, including minimum wage requirements, overtime, working and safety conditions and citizenship requirements. Because a significant number of our employees are paid at rates related to the state minimum wage, increases in the minimum wage would increase our labor costs. The failure to obtain required licenses or approvals, or an increase in the minimum wage rate, employee benefits costs (including costs associated with mandated health insurance coverage) or other costs associated with employees, could have a material adverse effect on us and our results of operations.
Companies engaged in the manufacturing, packaging and distribution of food products are subject to extensive regulation by various governmental agencies. A finding of failure to comply with one or more regulations could result in the imposition of sanctions, including the closing of all or a portion of our facilities for an indeterminate period of time, and could have a material adverse effect on us and our results of operations.
Information Technology System Failures, Breaches Of Our Network Security Or Inability To Upgrade Or Expand Our Technological Capabilities Could Interrupt Our Operations And Adversely Affect Our Business.
We and our franchisees rely on our computer systems and network infrastructure across our operations, including point-of-sale processing at our stores. Our and our franchisees’ operations depend upon our and our franchisees’ ability to protect our computer equipment and systems against damage from physical theft, fire, power loss, telecommunications failure or other catastrophic events, as well as from internal and external cybersecurity breaches, viruses and other disruptive problems. Any damage or failure of our computer systems or network infrastructure that causes an interruption in our operations could have a material adverse effect on our business and subject us or our franchisees to litigation or to actions by regulatory authorities. Furthermore, the importance of such information technology systems and networks increased in FY 2021 and continued into FY 2022 and FY 2023 due to many of our employees working remotely as a result of the COVID-19 pandemic.
A party who is able to compromise the security measures on our networks or the security of our infrastructure could, among other things, misappropriate our proprietary information and the personal information of our customers and employees, cause interruptions or malfunctions in our or our franchisee’s operations, cause delays or interruptions to our ability to operate, cause us to breach our legal, regulatory or contractual obligations, create an inability to access or rely upon critical business records or cause other disruptions in our operations. These breaches may result from human errors, equipment failure, fraud, or malice on the part of employees or third parties.
We expend financial resources to protect against such threats and may be required to further expend financial resources to alleviate problems caused by physical, electronic, and cyber security breaches. As techniques used to breach security are growing in frequency and sophistication and are generally not recognized until launched against a target, regardless of our expenditures and protection efforts, we may not be able to implement security measures in a timely manner or, if and when implemented, these measures could be circumvented. Any breaches that may occur could expose us to an increased risk of lawsuits, loss of existing or potential future customers, harm to our reputation and increases in our security costs, which could have a material adverse effect on our financial performance and operating results.
In the event of a breach resulting in loss of data, such as personally identifiable information or other such data protected by data privacy or other laws, we may be liable for damages, fines and penalties for such losses under applicable regulatory frameworks despite not handling the data. Further, the regulatory framework around data custody, data privacy and breaches varies by jurisdiction and is an evolving area of law. We may not be able to limit our liability or damages in the event of such a loss.
We are also continuing to expand, upgrade and develop our information technology capabilities, including our point-of-sale systems, as well as the adoption of cloud services for e-mail, intranet, and file storage. If we are unable to successfully upgrade or expand our technological capabilities, we may not be able to take advantage of market opportunities, manage our costs and transactional data effectively, satisfy customer requirements, execute our business plan or respond to competitive pressures. Additionally, unforeseen problems with our point-of-sale system may affect our operational abilities and internal controls and we may incur additional costs in connection with such upgrades and expansion.
If We, Our Business Partners, Or Our Franchisees Are Unable To Protect Our Customers’ Data, We Could Be Exposed To Data Loss, Litigation, Liability And Reputational Damage.
In connection with credit and debit card sales, we and our franchisees transmit confidential credit and debit card information by way of secure private retail networks. A number of retailers have experienced actual or potential security breaches in which credit and debit card information may have been stolen. Although we and our franchisees use private networks, third parties may have the technology or know-how to breach the security of the customer information transmitted in connection with credit and debit card sales, and our and our franchisees’ security measures and those of our and our franchisees’ technology vendors may not effectively prohibit others from obtaining improper access to this information. If a person were able to circumvent these security measures, he or she could destroy or steal valuable information or disrupt our and our franchisees’ operations. Any security breach could expose us and our franchisees to risks of data loss and liability and could seriously disrupt our and our franchisees’ operations and any resulting negative publicity could significantly harm our reputation. We may also be subject to lawsuits or other proceedings in the future relating to these types of incidents. Proceedings related to the theft of credit and debit card information may be brought by payment card providers, banks, and credit unions that issue cards, cardholders (either individually or as part of a class action lawsuit), and federal and state regulators. Any such proceedings could harm our reputation, distract our management team members from running our business and cause us to incur significant unplanned liabilities, losses and expenses.
We also sell and accept for payment gift cards, and our customer loyalty program provides rewards that can be redeemed for purchases. Like credit and debit cards, gift cards, and rewards earned by our customers are vulnerable to theft, whether physical or electronic. We believe that, due to their electronic nature, rewards earned through our customer loyalty program are primarily vulnerable to hacking. Customers affected by any loss of data or funds could litigate against us, and security breaches or even unsuccessful attempts at hacking could harm our reputation, and guarding against or responding to hacks could require significant time and resources.
We also receive and maintain certain personal information about our customers, including information received through our marketing programs, franchisees and business partners. Our collection, storage, handling, use, disclosure and security of this information is regulated by U.S. federal, state and local and foreign laws and regulations. If our security and information systems are compromised or our employees fail to comply with these laws and regulations and this information is obtained by unauthorized persons or used inappropriately, it could adversely affect our reputation, as well as the results of operations, and could result in litigation against us or the imposition of penalties. In addition, our ability to accept credit and debit cards as payment in our stores and online depends on us maintaining our compliance status with standards set by the PCI Security Standards Council. These standards, set by a consortium of the major credit card companies, require certain levels of system security and procedures to protect our customers’ credit and debit card information as well as other personal information. Privacy and information security laws and regulations change over time, and compliance with those changes may result in cost increases due to necessary system and process changes.
We Are Subject To Periodic Litigation, Which Could Result In Unexpected Expenses Of Time And Resources.
From time to time, we are called upon to defend ourselves against lawsuits relating to our business. Due to the inherent uncertainties of litigation, we cannot accurately predict the ultimate outcome of any such proceedings. An unfavorable outcome in any current or future legal proceedings could have an adverse impact on our business, and financial results. In addition, any significant litigation in the future, regardless of its merits, could divert management's attention from our operations and result in substantial legal fees. Any litigation could result in substantial costs and a diversion of management's attention and resources that are needed to successfully run our business.
Changes In Health Benefit Claims And Healthcare Reform Legislation Could Have A Material Adverse Effect On Our Operations.
We accrue for costs to provide self-insured benefits for our employee health benefits program. We accrue for self-insured health benefits based on historical claims experience and we maintain insurance coverage to prevent financial losses from catastrophic health benefit claims. We monitor pending and enacted legislation in an effort to evaluate the effects of such legislation upon our business. Our financial position or results of operations could be materially adversely impacted should we experience a material increase in claims costs or a change in healthcare legislation that impacts our business.
Our Expansion Into New Markets May Present Increased Risks Due To Our Unfamiliarity With Those Areas And Our Target Customers’ Unfamiliarity With Our Brands.
Consumers in any new markets we enter will not be familiar with our brands, and we will need to build brand awareness in those markets through significant investments in advertising and promotional activity. We may find it more difficult in new markets to secure desirable locations and to hire, motivate and keep qualified employees.
Issues Or Concerns Related To The Quality And Safety Of Our Products, Ingredients Or Packaging Could Cause A Product Recall And/Or Result In Harm To The Company’s Reputation, Negatively Impacting Our Results Of Operations.
In order to sell our products, we need to maintain a good reputation with our customers and consumers. Issues related to the quality and safety of our products, ingredients or packaging could jeopardize our Company’s image and reputation. Negative publicity related to these types of concerns, or related to product contamination or product tampering, whether valid or not, could decrease demand for our products or cause production and delivery disruptions. We may need to recall products if any of our products become unfit for consumption. In addition, we could potentially be subject to litigation or government actions, which could result in payments of fines or damages. Costs associated with these potential actions could negatively affect our results of operations.
Our Financial Results May Be Adversely Impacted By The Failure To Successfully Execute Or Integrate Acquisitions, Divestitures And Joint Ventures.
From time to time, we may evaluate potential acquisitions, divestitures or joint ventures that align with our strategic objectives. The success of such activity depends, in part, upon our ability to identify suitable buyers, sellers or business partners; perform effective assessments prior to contract execution; negotiate contract terms; and, if applicable, obtain government approval. These activities may present certain financial, managerial, staffing and talent, and operational risks, including diversion of management’s attention from existing core businesses; difficulties integrating or separating businesses from existing operations; and challenges presented by acquisitions or joint ventures which may not achieve sales levels and profitability that justify the investments made. If the acquisitions, divestitures or joint ventures are not successfully implemented or completed, there could be a negative impact on our results of operations.
Provisions In Our Organizational Documents, As Well As Provisions Of Delaware Law, Could Make It More Difficult Or Costly For A Third Party To Acquire Us, Even If Doing So Would Benefit Our Stockholders, And Could Limit Attempts To Make Changes In Our Management.
Our amended and restated certificate of incorporation and bylaws, as well as Delaware law, contain provisions that could make it more difficult for a third party to acquire us without the consent of our Board of Directors. These provisions include the following:
| |
● |
Authorize the issuance of “blank check” preferred stock, which is preferred stock with voting or other rights or preferences that could impede a takeover attempt and that the Board of Directors can create and issue without prior stockholder approval; |
| |
● |
Establish advance notice requirements for submitting nominations for election to the Board of Directors and for proposing matters that can be acted upon by stockholders at a meeting; |
| |
● |
Prohibit stockholder actions by written consent, which means all stockholder actions must be taken at a meeting of our stockholders; and |
| |
● |
Require super-majority voting to amend some provisions in our certificate of incorporation and to amend our bylaws. |
Although we believe all of these provisions will make a higher third-party bid more likely by requiring potential acquirers to negotiate with the Board of Directors, these provisions will apply even if an initial offer may be considered beneficial by some stockholders and therefore could delay and/or prevent a deemed beneficial offer from being considered. These provisions could also discourage proxy contests and make it more difficult for our stockholders to elect directors and take other corporate actions, which may prevent a change of control or changes in our management that a stockholder might consider favorable. In addition, Section 203 of the Delaware General Corporation Law may discourage, delay, or prevent a change in control of us. Any delay or prevention of a change of control or change in management that stockholders might otherwise consider to be favorable could cause the market price of our common stock to decline.
Our Common Stock Price May Be Volatile Or May Decline Regardless Of Our Operating Performance.
Volatility in the market price of our common stock may prevent you from being able to sell your shares at or above the price you paid for such shares. Many factors, which are outside our control, may cause the market price of our common stock to fluctuate significantly, including those described elsewhere in this “Risk Factors” section and this Annual Report, as well as the following:
| |
● |
Our operating and financial performance and prospects; |
| |
● |
Our quarterly or annual earnings or those of other companies in our industry compared to market expectations; |
| |
● |
Conditions that impact demand at our stores and for our products; |
| |
● |
Future announcements concerning our business or our competitors’ businesses; |
| |
● |
The public’s reaction to our press releases, other public announcements and filings with the SEC; |
| |
● |
The size of our public float, and the trading volume of our common stock; |
| |
● |
Coverage by or changes in financial estimates by securities analysts or failure to meet their expectations; |
| |
● |
Market and industry perception of our success, or lack thereof, in pursuing our growth strategy; |
| |
● |
Strategic actions by us or our competitors, such as acquisitions or restructurings; |
| |
● |
Changes in laws or regulations which adversely affect our industry or us; |
| |
● |
Changes in accounting standards, policies, guidance, interpretations or principles; |
| |
● |
Changes in senior management or key personnel; |
| |
● |
Issuances, exchanges or sales, or expected issuances, exchanges or sales of our capital stock; |
| |
● |
Changes in our dividend policy; |
| |
● |
Adverse resolution of new or pending litigation against us; and |
| |
● |
Changes in general market, economic and political conditions in the United States and global economies or financial markets, including those resulting from natural disasters, terrorist attacks, pandemics, public health crises, acts of war and responses to such events. |
As a result, volatility in the market price of our common stock may prevent investors from being able to sell their common stock at or above the price they paid for such shares. These broad market and industry factors may materially reduce the market price of our common stock, regardless of our operating performance. In addition, price volatility may be greater if the public float and trading volume of our common stock is low. As a result, you may suffer a loss on your investment.
Risks Related to the Economy
Global Or Regional Health Pandemics Or Epidemics Could Negatively Impact Our Business Operations, Financial Performance And Results Of Operations.
Our business and financial results could be negatively impacted by pandemics or epidemics. The severity, magnitude and duration of global or regional pandemics or epidemics are uncertain and hard to predict. COVID-19 significantly impacted economic activity and markets around the world, and resulted in broader supply, transportation and labor disruptions resulting in inflation and generally higher operating costs in our business. Relatedly, commodity and transportation costs have become more volatile and generally increased since the COVID-19 pandemic, as have supply chain disruptions, and transportation and labor shortages. Additionally, government or regulatory responses to pandemics could negatively impact our business. Mandatory lockdowns or other restrictions on operations in some countries temporarily disrupted our ability to distribute our products in some markets. Resumption, continuation or expansion of these disruptions could materially adversely impact our operations and results.
These and other impacts of global or regional health pandemics or epidemics could have the effect of heightening many of the other risks described in the risk factors presented in this filing, including but not limited to those relating to our reputation, brands, consumer preferences, supply chain, product sales, pricing actions, results of operations or financial condition. We might not be able to predict or respond to all impacts on a timely basis to prevent near- or long-term adverse impacts to our results. The ultimate impact of these disruptions also depends on events beyond our knowledge or control, including the duration and severity of other pandemics or epidemics and actions taken by parties other than us to respond to them. Any of these disruptions could have a negative impact on our business operations, financial performance, results of operations and stock price, and this impact could be material.
General Economic Conditions Could Have A Material Adverse Effect On Our Business, Results Of Operations And Liquidity Or Our Franchisees, With Adverse Consequences To Us.
Consumer purchases of discretionary items, including our products, often decline during weak economic periods where disposable income is adversely affected. Our performance is subject to factors that affect worldwide economic conditions, including employment, consumer debt, reductions in net worth based on severe market declines, residential real estate and mortgage markets, taxation, fuel and energy prices, interest rates, consumer confidence, public health, the value of the U.S. dollar versus foreign currencies and other macroeconomic factors. These factors may cause consumers to purchase products from lower priced competitors or to defer purchases of discretionary products altogether.
Economic weakness could have a material effect on our results of operations, liquidity and capital resources. It could also impact our ability to fund growth and/or result in us becoming more reliant on external financing, the availability and terms of which may be uncertain. In addition, a weak economic environment may exacerbate the other risks noted below.
We rely in large part on our franchisees and the manner in which they operate their stores to develop and promote our business. It is possible that additional franchisees could file for bankruptcy, become delinquent in their payments to us, or simply shut down which could have a significant adverse impact on our business due to loss of factory sales and loss or delay in payments of royalties, contributions to our marketing fund and other fees. Additionally, the availability of credit to our small business franchisees may be curtailed due to tighter credit conditions in the marketplace, and as a result could delay or preclude franchisees from making required store upgrades.
Although we have developed, and continue to develop, evolving criteria to evaluate and screen prospective developers and franchisees, we cannot be certain that the developers and franchisees we select will have the business acumen or financial resources necessary to open and operate successful franchises in their franchise areas, and state franchise laws may limit our ability to terminate or modify these franchise arrangements. Moreover, franchisees may not successfully operate stores in a manner consistent with our standards and requirements, or may not hire and train qualified managers and other store personnel. The failure of developers and franchisees to open and operate franchises successfully could have a material adverse effect on us, our reputation, our brand and our ability to attract prospective franchisees and could materially adversely affect our business, financial condition, results of operations and cash flows.
We Currently, And May In The Future, Have Assets Held At Financial Institutions That May Exceed The Insurance Coverage Offered By The Federal Deposit Insurance Corporation (“FDIC”), The Loss Of Which Would Have A Severe Negative Affect On Our Operations And Liquidity.
We may maintain our cash assets at financial institutions in the U.S. in amounts that may be in excess of the FDIC insurance limit of $250,000. In the event of a failure or liquidity issues at any of the financial institutions where we maintain our deposits or other assets, we may incur a loss to the extent such loss exceeds the FDIC insurance limitation, which could have a material adverse effect upon our liquidity, financial condition and our results of operations. Similarly, if our customers or partners experience liquidity issues as a result of financial institution defaults or non-performance where they hold cash assets, their ability to pay us may become impaired and could have a material adverse effect on our results of operations, including the collection of accounts receivable and cash flows.
Risks Related to Our Franchisees
The Financial Performance Of Our Franchisees Can Negatively Impact Our Business.
Our financial results are dependent in part upon the operational and financial success of our franchisees. Franchisees purchase product from us and we receive royalties, franchise fees, contributions to our marketing fund, and other fees from our franchisees. We have established operational standards and guidelines for our franchisees; however, we have limited control over how our franchisees’ businesses are run. While we are responsible for ensuring the success of our entire system of stores and for taking a longer-term view with respect to system improvements, our franchisees have individual business strategies and objectives, which might conflict with our interests. Our franchisees may not be able to secure adequate financing to open or continue operating their Rocky Mountain Chocolate Factory stores. If they incur too much debt or if economic or sales trends deteriorate such that they are unable to repay existing debt, our franchisees could experience financial distress or even bankruptcy. If a significant number of franchisees become financially distressed, it could harm our operating results through reduced royalty revenues and the impact on our profitability could be greater than the percentage decrease in the royalty revenues. This would reduce our royalty revenues and could negatively impact margins, since we may not be able to reduce fixed costs which we continue to incur.
We Have Limited Control With Respect To The Operations Of Our Franchisees, Which Could Have A Negative Impact On Our Business.
Franchisees are independent business operators and are not our employees, and we do not exercise control over the day-to-day operations of their stores. We provide training and support to franchisees, and set and monitor operational standards, but the quality of franchised stores may be diminished by any number of factors beyond our control. Consequently, franchisees may not successfully operate stores in a manner consistent with our standards and requirements, or may not hire and train qualified managers and other store personnel. If franchisees do not operate to our expectations, our image and reputation, and the image and reputation of other franchisees, may suffer materially and system-wide sales could decline significantly, which would reduce our royalty revenues, and the impact on profitability could be greater than the percentage decrease in royalties and fees.
A Significant Shift By Franchisees From Company-Manufactured Products To Products Produced By Third Parties Could Adversely Affect Our Operations.
In FY 2023, approximately 49% of franchised stores' revenues are generated by sales of products manufactured by and purchased from us, 48% by sales of products made in the stores with ingredients purchased from us or approved suppliers and 3% by sales of products purchased from approved suppliers for resale in the stores. Franchisees' sales of products manufactured by us generate higher revenues to us than sales of store-made or other products. We have seen a significant increase in system-wide sales of store-made and other products, which has led to a decrease in purchases from us and has had an adverse effect on our revenues. If this trend continues, it could further adversely affect our total revenues and results of operations. Such a decrease could result from franchisees' decisions to sell more store-made products or products purchased from approved third party suppliers.
Risks Related to Our Supply Chain
Increase In Ingredient And Other Operating Costs, Including Those Caused By Weather And Food Safety, Could Adversely Affect Our Results Of Operations.
Our Company-owned and franchised stores could also be harmed by supply chain interruptions including those caused by factors beyond our control or the control of our suppliers. However, prolonged disruption in the supply of products from or to our manufacturing facility due to weather, natural disasters, food safety incidents, regulatory compliance, labor dispute or interruption of service by carriers could increase costs, limit the availability of ingredients critical to our store operations and have a significant impact on results. Increasing weather volatility or other long-term changes in global weather patterns could have a significant impact on the price or availability of some of our ingredients, energy and other materials throughout our supply chain. In particular, adverse weather or cocoa beans or nuts shortages could disrupt the supply of key ingredients to our and our franchisees’ stores. Insolvency of key suppliers could also cause similar business interruptions and negatively impact our business.
Disruption To Our Manufacturing Facility Or Supply Chain Could Impair Our Ability To Produce Or Deliver Finished Products, Resulting In A Negative Impact On Our Results Of Operations.
All of our manufacturing operations are located in Durango, Colorado. Disruption to our manufacturing facility or to our supply chain could result from a number of factors, including natural disasters, pandemics, outbreak of disease, weather, fire or explosion, terrorism or other acts of violence, labor strikes or other labor activities, unavailability of raw or packaging materials, and operational and/or financial instability of key suppliers and other vendors or service providers. We believe that we take adequate precautions to mitigate the impact of possible disruptions. We have strategies and plans in place to manage disruptive events if they were to occur. However, if we are unable, or find that it is not financially feasible, to effectively plan for or mitigate the potential impacts of such disruptive events on our manufacturing facility or supply chain, our financial condition and results of operations could be negatively impacted.
ITEM 1B. UNRESOLVED STAFF COMMENTS
None.
ITEM 2. PROPERTIES
Our manufacturing operations and corporate headquarters are located at 265 Turner Drive, Durango, Colorado 81303, which is a 53,000 square foot manufacturing facility that we own. During FY 2023, our manufacturing operations produced approximately 1.69 million pounds of chocolate candies, which was a decrease of approximately 9.9% from the approximately 1.88 million pounds produced in FY 2022. We believe our manufacturing facility has the capacity to produce approximately 5.3 million pounds per year, subject to certain assumptions about product mix, which we believe is sufficient for our current operating needs. In addition to our manufacturing facility, we own a two-acre parcel adjacent to our manufacturing facility to ensure the availability of adequate space to expand as volume demands.
As of February 28, 2023, the Company had obligations for one non-cancelable lease for our Flagship Store having an expiration date of January 31, 2026, which contains an optional ten-year renewal right. We do not deem this store lease to be material in relation to our overall operations.
For information as to the amount of our rental obligations under leases on both Company-owned and franchised stores, see Note 10 “Leasing Arrangements” to our consolidated financial statements included in Item 8 of this Annual Report.
ITEM 3. LEGAL PROCEEDINGS
Item 1. Legal Proceedings
The information set forth in Note 1 to the consolidated financial statements under the caption “Subsequent Events” appearing in Item 1 of Part I of the Company’s Quarterly Report on Form 10-Q for the quarterly period ended November 30, 2022, is incorporated by reference herein.
The Company is a party to various other legal proceedings arising in the ordinary course of business from time to time. Management believes that the resolution of these matters will not have a material adverse effect on the Company’s financial position, results of operations or cash flows.
ITEM 4. MINE SAFETY DISCLOSURES
Not Applicable.
PART II.
ITEM 5. MARKET FOR REGISTRANT’S COMMON EQUITY, RELATED STOCKHOLDER MATTERS AND ISSUER PURCHASES OF EQUITY SECURITIES
Market Information
Our shares of common stock trade on the Nasdaq Global Market tier of The Nasdaq Stock Market under the trading symbol “RMCF.”
Holders
On May 19, 2023, there were approximately 430 record holders of our common stock. This figure does not include an estimate of the number of beneficial holders whose shares are held of record by banks, broker or other nominees.
Dividends
Although we have previously paid cash dividends on our common stock, we have no present intention to pay cash dividends on our common stock. Any determination to pay dividends to holders of our common stock will be at the discretion of our board of directors and will depend upon many factors, including our financial condition, results of operations, projections, liquidity, earnings, legal requirements, restrictions in our existing and any future debt and other factors that our board of directors deems relevant.
ITEM 6. RESERVED
ITEM 7. MANAGEMENT'S DISCUSSION AND ANALYSIS OF FINANCIAL CONDITION AND RESULTS OF OPERATIONS
This Management’s Discussion and Analysis (“MD&A”) is intended to assist in an understanding of our financial condition and should be read in conjunction with our Consolidated Financial Statements and accompanying Notes included in Item 8 of this Annual Report. The following discussion contains forward-looking statements that reflect our plans, estimates and beliefs, and involve risks and uncertainties. Our actual results may differ materially from those anticipated in these forward-looking statements as a result of various factors, including those discussed elsewhere in this Annual Report, particularly in Item 1A. “Risk Factors.”
Overview
Rocky Mountain Chocolate Factory, Inc., a Delaware corporation, and its subsidiaries (including its operating subsidiary with the same name, Rocky Mountain Chocolate Factory, Inc., a Colorado corporation (“RMCF”) (referred to as the “Company,” “we,” “us,” or “our”) is an international franchisor, confectionery manufacturer and retail operator. Founded in 1981, we are headquartered in Durango, Colorado and manufacture an extensive line of premium chocolate candies and other confectionery products. Our revenues and profitability are derived principally from our franchised/licensed system of retail stores that feature chocolate and other confectionary products. We also sell our candy in select locations outside of our system of retail stores and license the use of our brand with certain consumer products. As of February 28, 2023, there was one Company-owned, 111 licensee-owned and 157 franchised Rocky Mountain Chocolate Factory stores operating in 37 states, Panama, and the Philippines.
On May 1, 2023, subsequent to the end of FY 2023, the Company completed the sale of substantially all of the assets of its wholly-owned subsidiary and frozen yogurt business, U-Swirl International, Inc. (“U-Swirl”). The aggregate sale price of U-Swirl was $2.75 million, consisting of (i) $1.75 million in cash and (ii) $1.0 million evidenced by a three-year secured promissory note. The business divestiture of the U-Swirl segment was preceded by a separate sale of the Company’s three owned U-Swirl locations on February 24, 2023. The consolidated financial statements present the historical financial results of the former U-Swirl segment as discontinued operations for all periods presented. See Note 20 of the Notes to Consolidated Financial Statements included in Item 8, “Financial Statements and Supplementary Data“, of this Annual Report for information on this divestiture.
With the sale of our frozen yogurt segment on May 1, 2023, we continue to focus on our confectionery business to further enhance our competitive position and operating margin, simplify our business model, and deliver sustainable value to our stockholders.
Current Trends Affecting Our Business and Outlook
As a result of recent macroeconomic inflationary trends and disruptions to the global supply chain, we have experienced and expect to continue experiencing higher raw material, labor, and freight costs. We have seen labor and logistics challenges, which we believe have contributed to lower factory, retail and e-commerce sales of our products due to the availability of material, labor and freight. In addition, we could experience additional lost sale opportunities if our products are not available for purchase as a result of continued disruptions in our supply chain relating to an inability to obtain ingredients or packaging, labor challenges at our logistics providers or our manufacturing facility, or if we or our franchisees experience delays in stocking our products.
During FY 2023 and FY 2022, the Company incurred substantial costs associated with a stockholder’s contested solicitation of proxies in connection with our 2022 and 2021 annual meeting of stockholders. During FY 2023, the Company incurred approximately $4.1 million of costs associated with the contested solicitation of proxies, compared with $1.7 million incurred in FY 2022. These costs are recognized as general and administrative expense in the Consolidated Statement of Operations. Additionally, as a result of the contested solicitation of proxies and the resulting changes to the composition of the Company’s Board of Directors, at the 2021 annual meeting of stockholders, the Company incurred $1.1 million of accrued severance costs and accelerated restricted stock unit expense during FY 2023 and incurred $1.9 million of accrued severance costs and accelerated restricted stock unit expense during FY 2022. These costs were incurred associated with the retirement of the Company’s former CEO and the retirement of the Company’s former Senior Vice President – Sales and Marketing.
We are subject to seasonal fluctuations in sales because of key holidays and the location of our franchisees, which have traditionally been located in resort or tourist locations, and the nature of the products we sell, which are highly seasonal. Historically, the strongest sales of our products have occurred during key holidays and summer vacation seasons. Additionally, quarterly results have been, and in the future are likely to be, affected by the timing of new store openings and sales of franchises. Because of the seasonality of our business and the impact of new store openings and sales of franchises, results for any quarter are not necessarily indicative of results that may be achieved in other quarters or for a full fiscal year.
The most important factors in continued growth in our earnings are our ability to increase the sales of premium chocolate products manufactured in our manufacturing facility, the ability to manufacture more efficiently, supporting our franchisees in increasing the frequency and average value of customer transactions, ongoing online revenue growth, and unit growth.
Our ability to successfully achieve expansion of our franchise systems depends on many factors not within our control including the availability of suitable sites for new store establishment and the availability of qualified franchisees to support such expansion.
Efforts to reverse the decline in same store pounds purchased from the factory by franchised stores and to increase total factory sales depend on many factors, including new store openings, competition, the receptivity of our franchise system to our product introductions and promotional programs. During FY 2023, same store pounds purchased from our manufacturing facility by franchised and co-branded licensed stores increased by approximately 3.9% in the first quarter, declined by approximately 15.4% in the second quarter, increased by approximately 5.7% in the third quarter, declined approximately 8.0% in the fourth quarter, and declined 3.3% overall in FY 2023 as compared to the same periods in FY 2022.
Termination of Strategic Partnership with Edible Arrangements
On November 1, 2022, the Company sent a formal notice to Edible Arrangements®, LLC and its affiliates (“Edible”) terminating the strategic alliance and ecommerce agreements with Edible. Prior to such termination, the Company sold its confectionary products in Edible’s store locations and ecommerce platform. On November 1, 2022, the Company sent a formal notice to Edible terminating the Exclusive Supplier Operating Agreement, dated December 20, 2019 (“Exclusive Supplier Agreement”), by and between the Company and Edible, and the Ecommerce Licensing Agreement, dated March 16, 2020 (“Licensing Agreement”), by and between the Company and Edible. Subsequent to the termination of the Supplier Agreement and Licensing Agreement, the Company has no remaining material obligations under the Strategic Alliance Agreement, dated as of December 20, 2019, by and among the Company, Farids & Co. LLC and Edible Arrangements; the Common Stock Purchase Warrant, dated December 20, 2019, issued to Edible; and the Indemnification Letter Agreement, dated March 16, 2020, by and between the Company and Edible.
Results of Continuing Operations
Fiscal 2023 Compared To Fiscal 2022
Results Summary
Basic loss per share increased from a net loss from continuing operations of $(0.08) per share in FY 2022 to a net loss from continuing operations of $(0.88) per share in FY 2023. Revenues increased by 3.2% from $29.5 million for FY 2022 to $30.4 million for FY 2023. Operating loss increased from an operating loss of $695,000 in FY 2022 to an operating loss of $4.9 million in FY 2023. Net loss from continuing operations increased from a net loss of $500,000 in FY 2022 to a net loss of $6.0 million in FY 2023.
REVENUES
| |
|
For the Year Ended |
|
|
|
|
|
|
|
|
|
| ($'s in thousands) |
|
February 28, |
|
|
$ |
|
|
% |
|
| |
|
2023 |
|
|
2022 |
|
|
Change |
|
|
Change |
|
| Factory sales |
|
$ |
23,372.1 |
|
|
$ |
22,374.2 |
|
|
$ |
997.9 |
|
|
|
4.5 |
% |
| Retail sales |
|
|
1,084.8 |
|
|
|
1,160.3 |
|
|
|
(75.5 |
) |
|
|
(6.5 |
)% |
| Franchise fees |
|
|
204.7 |
|
|
|
179.7 |
|
|
|
25.0 |
|
|
|
13.9 |
% |
| Royalty and marketing fees |
|
|
5,770.8 |
|
|
|
5,774.4 |
|
|
|
(3.6 |
) |
|
|
(0.1 |
)% |
| Total |
|
$ |
30,432.4 |
|
|
$ |
29,488.6 |
|
|
$ |
943.8 |
|
|
|
3.2 |
% |
Factory Sales
The increase in factory sales for FY 2023 compared to FY 2022 was primarily due to an 6.8%, $1.3 million, increase in sales of product to our network of franchised and licensed retail stores partially offset by a 6.8%, $257,000, decrease in shipments of product to customers outside our network of franchised retail stores.
In FY 2023, same store pounds purchased by franchisees and licensees declined 3.3% compared to the prior fiscal year. We continue to add new products and focus our existing product lines in an effort to increase same store pounds purchased by existing locations.
Retail Sales
Retail sales at Company-owned stores decreased by 6.5% from $1.2 million in FY 2022 to $1.1 million in FY 2023. This was the result of an increase in same store sales, more than offset by the sale of one Company-owned store during the year. In November 2022 the Company sold a Rocky Mountain Chocolate Factory Company-owned store located in Peoria, Illinois, to a franchisee. As a result of this sale of a Company owned location, the Company operated only its Flagship Store in Durango, CO on February 28, 2023. During FY 2023 sales at the Company’s Flagship Store increased 13.6% to $886,000 compared to $846,000 during FY 2022.
Royalties, Marketing Fees and Franchise Fees
Royalty and marketing fees were approximately unchanged during FY 2023 compared to FY 2022. Same-store sales at all domestic franchise locations increased by 0.5% during FY 2023, when compared to FY 2022.
The increase in franchise fee revenue during FY 2023 compared to FY 2022 was primarily the result of store closures and the acceleration of unrecognized franchise fee revenue.
COSTS AND EXPENSES
Cost of Sales
| |
|
For the Year Ended |
|
|
|
|
|
|
|
|
|
| |
|
February 28, |
|
|
$ |
|
|
% |
|
| ($'s in thousands) |
|
2023 |
|
|
2022 |
|
|
Change |
|
|
Change |
|
| |
|
|
|
|
|
|
|
|
|
|
|
|
|
|
|
|
| Cost of sales - factory |
|
$ |
20,023.4 |
|
|
$ |
18,153.8 |
|
|
$ |
1,869.6 |
|
|
|
10.3 |
% |
| Cost of sales - retail |
|
|
431.9 |
|
|
|
456.9 |
|
|
|
(25.0 |
) |
|
|
(5.5 |
)% |
| Franchise costs |
|
|
1,825.8 |
|
|
|
1,915.0 |
|
|
|
(89.2 |
) |
|
|
(4.7 |
)% |
| Sales and marketing |
|
|
2,060.2 |
|
|
|
1,474.8 |
|
|
|
585.4 |
|
|
|
39.7 |
% |
| General and administrative |
|
|
10,325.7 |
|
|
|
7,456.3 |
|
|
|
2,869.4 |
|
|
|
38.5 |
% |
| Retail operating |
|
|
537.5 |
|
|
|
606.9 |
|
|
|
(69.4 |
) |
|
|
(11.4 |
)% |
| Total |
|
$ |
35,204.5 |
|
|
$ |
30,063.7 |
|
|
$ |
5,140.8 |
|
|
|
17.1 |
% |
| Gross Margin |
|
For the Year Ended |
|
|
|
|
|
|
|
|
|
| |
|
February 28, |
|
|
$ |
|
|
% |
|
| ($'s in thousands) |
|
2023 |
|
|
2022 |
|
|
Change |
|
|
Change |
|
| |
|
|
|
|
|
|
|
|
|
|
|
|
|
|
|
|
| Factory gross margin |
|
$ |
3,348.7 |
|
|
$ |
4,220.4 |
|
|
$ |
(871.7 |
) |
|
|
(20.7 |
)% |
| Retail gross margin |
|
|
652.9 |
|
|
|
703.4 |
|
|
|
(50.5 |
) |
|
|
(7.2 |
)% |
| Total |
|
$ |
4,001.6 |
|
|
$ |
4,923.8 |
|
|
$ |
(922.2 |
) |
|
|
(18.7 |
)% |
| Gross Margin |
|
For the Year Ended |
|
|
|
|
|
|
|
|
|
| |
|
February 28, |
|
|
% |
|
|
% |
|
| |
|
2023 |
|
|
2022 |
|
|
Change |
|
|
Change |
|
| (Percent) |
|
|
|
|
|
|
|
|
|
|
|
|
|
|
|
|
| Factory gross margin |
|
|
14.3 |
% |
|
|
18.9 |
% |
|
|
(4.6 |
)% |
|
|
(24.3 |
)% |
| Retail gross margin |
|
|
60.2 |
% |
|
|
60.6 |
% |
|
|
(0.4 |
)% |
|
|
(0.7 |
)% |
| Total |
|
|
16.4 |
% |
|
|
20.9 |
% |
|
|
(4.5 |
)% |
|
|
(21.5 |
)% |
| Adjusted Gross Margin |
|
For the Year Ended |
|
|
|
|
|
|
|
|
|
| (a non-GAAP measure) |
|
February 28, |
|
|
$ |
|
|
% |
|
| ($'s in thousands) |
|
2023 |
|
|
2022 |
|
|
Change |
|
|
Change |
|
| |
|
|
|
|
|
|
|
|
|
|
|
|
|
|
|
|
| Factory gross margin |
|
$ |
3,348.7 |
|
|
$ |
4,220.4 |
|
|
$ |
(871.7 |
) |
|
|
(20.7 |
)% |
| Plus: depreciation and amortization |
|
|
646.4 |
|
|
|
620.8 |
|
|
|
25.6 |
|
|
|
4.1 |
% |
| Factory adjusted gross margin (non-GAAP measure) |
|
|
3,995.1 |
|
|
|
4,841.2 |
|
|
|
(846.1 |
) |
|
|
(17.5 |
)% |
| Retail gross margin |
|
|
652.9 |
|
|
|
703.4 |
|
|
|
(50.5 |
) |
|
|
(7.2 |
)% |
| Total Adjusted Gross Margin (non-GAAP measure) |
|
$ |
4,648.0 |
|
|
$ |
5,544.6 |
|
|
$ |
(896.6 |
) |
|
|
(16.2 |
)% |
| |
|
|
|
|
|
|
|
|
|
|
|
|
|
|
|
|
| Factory adjusted gross margin (non-GAAP measure) |
|
|
17.1 |
% |
|
|
21.6 |
% |
|
|
(4.5 |
)% |
|
|
(20.8 |
)% |
| Retail gross margin |
|
|
60.2 |
% |
|
|
60.6 |
% |
|
|
(0.4 |
)% |
|
|
(0.7 |
)% |
| Total Adjusted Gross Margin (non-GAAP measure) |
|
|
19.0 |
% |
|
|
23.6 |
% |
|
|
(4.6 |
)% |
|
|
(19.5 |
)% |
Non-GAAP Measures
In addition to the results provided in accordance with U.S. GAAP, we provide certain non-GAAP measures, which present results on an adjusted basis. These are supplemental measures of performance that are not required by or presented in accordance with U.S. GAAP. Adjusted gross margin and factory adjusted gross margin are non-GAAP measures. Adjusted gross margin is equal to the sum of our factory adjusted gross margin plus our retail gross margin calculated in accordance with GAAP. Factory adjusted gross margin is equal to factory gross margin plus depreciation and amortization expense. We believe adjusted gross margin and factory adjusted gross margin are helpful in understanding our past performance as a supplement to gross margin, factory gross margin and other performance measures calculated in conformity with GAAP. We believe that adjusted gross margin and factory adjusted gross margin are useful to investors because they provide a measure of operating performance and our ability to generate cash that is unaffected by non-cash accounting measures. Additionally, we use adjusted gross margin and factory adjusted gross margin rather than gross margin and factory gross margin to make incremental pricing decisions. Adjusted gross margin and factory adjusted gross margin have limitations as analytical tools because they exclude the impact of depreciation and amortization expense and you should not consider it in isolation or as a substitute for any measure reported under GAAP. Our use of capital assets makes depreciation and amortization expense a necessary element of our costs and our ability to generate income. Due to these limitations, we use adjusted gross margin and factory adjusted gross margin as measures of performance only in conjunction with GAAP measures of performance such as gross margin and factory gross margin.
Cost of Sales and Gross Margin
Factory gross margins decreased to 14.3% in FY 2023 compared to a gross margin of 18.9% during FY 2022, due primarily to a 9.9% decrease in production volume and a $386,000 increase in expense associated with obsolete inventory. The decrease in production volume was primarily due to a 6.2% decrease in shipments of manufactured items. Additionally, production volume decreased and expense incurred associated with obsolete inventory increased as a result of the Company undertaking an aggressive effort to rationalize the products it offers and reduce total inventory levels. Total inventory decreased by 15.3% at February 28, 2023, compared with the inventory on February 28, 2022.
Retail gross margins decreased from 60.6% during FY 2022, to 60.2% during FY 2023. The decrease in retail gross margins was primarily the result of an increase in the costs of raw materials.
Franchise Costs
The decrease in franchise costs in FY 2023 compared to FY 2022 was due primarily to a decrease in professional fees, the result of litigation with our former licensee in Canada incurred during the prior year, with no comparable legal expense in the current year. As a percentage of total royalty and marketing fees and franchise fee revenue, franchise costs decreased to 30.6% in FY 2023 from 32.2% in FY 2022. This decrease as a percentage of royalty, marketing and franchise fees is primarily a result of higher royalty fees partially offset by higher costs.
Sales and Marketing
The increase in sales and marketing costs during FY 2023 compared to FY 2022 was due to an increase in equity compensation costs and contract labor associated with the retirement of our former Senior Vice President of Sales and Marketing, and an increase in advertising costs.
General and Administrative
The increase in general and administrative costs during FY 2023, compared to FY 2022, was due primarily to costs associated with a stockholder’s contested solicitation of proxies in connection with our 2022 annual meeting of stockholders. During FY 2023, the Company incurred approximately $4.1 million of costs associated with the contested solicitation of proxies, compared with $1.7 million of costs associated with a contested solicitation of proxies during FY 2022. The Company also incurred increased professional fees related to legal support for our Board of Directors and legal costs associated with compensation arrangements for our former Chief Executive Officer and Chief Financial Officer and legal and professional costs associated with the search for, and appointment of, a new Chief Executive Officer and a new Chief Financial Officer. Additionally, due to a stockholder’s contested solicitation of proxies in connection with our 2021 annual meeting of stockholders, the Company had become contingently liable for certain change in control severance payments to our former Senior Vice President of Sales and Marketing if a triggering termination was to occur. As a result of our former Senior Vice President - Sales and Marketing’s retirement in September 2022, the Company incurred $1.1 million of associated severance costs. As a percentage of total revenues, general and administrative expenses increased to 33.9% during FY 2023, compared to 25.3% during FY 2022.
Retail Operating Expenses
Retail operating expenses decreased 11.4% during FY 2023 compared to FY 2022. Retail operating expenses, as a percentage of retail sales, decreased from 52.3% during FY 2022 to 49.5% in FY 2023. This decrease is primarily the result of the sale of a Company-owned location. In November 2022 the Company sold a Rocky Mountain Chocolate Factory Company-owned store located in Peoria, Illinois, to a franchisee. The result is that as of February 28, 2023, the company operated only one Rocky Mountain Chocolate Factory Company-owned location.
Depreciation and Amortization
Depreciation and amortization, exclusive of depreciation and amortization included in cost of sales, was $119,000 during FY 2023, it was approximately unchanged from $119,000 incurred during FY 2022. Depreciation and amortization included in cost of sales increased 4.1% from $621,000 during FY 2022 to $646,000 during FY 2023. This increase was the result of investment in equipment.
Other Income (Expense)
Other income was $16,500 during FY 2023, compared to other income of $178,000 during FY 2022. Net interest income was $16,500 during FY 2023, compared to interest income of $11,000 during FY 2022.
The Company recognized a gain on insurance recovery of $167,100 during FY 2022, compared with no similar amounts recognized during FY 2023.
Income Tax Expense
During FY 2023, we incurred an income tax expense of $614,000 on a loss from continuing operations before income taxes of $4.9 million compared to an income tax benefit of $17,000 realized on a loss from continuing operations before income taxes of $517,000 during FY 2022. The FY 2023 expense was the result of recording a full valuation allowance on our deferred income tax assets. See Note 14 to the financial statements for a description of income taxes, deferred tax assets, and associated reserves.
Fiscal 2022 Compared To Fiscal 2021
Results Summary
Basic earnings per share from continuing operations decreased from a net loss from continuing operations of $(0.07) per share in FY 2021 to a net loss from continuing operations of $(0.08) per share in FY 2022. Revenues increased 35.5% from $21.8 million for FY 2021 to $29.5 million for FY 2022. Operating loss decreased from an operating loss of $(2.7) million in FY 2021 to an operating loss of $(695,000) in FY 2022. Net loss from continuing operations increased from a net loss of $(410,000) in FY 2021 to a net loss of $(500,000) in FY 2022. The increase in revenue was due primarily to the impacts from the COVID-19 pandemic during FY 2021, including its impact on our operation and the operations of our franchised, licensed and Company-owned locations. During FY 2022, many of the disruptions experienced as a result of the COVID-19 pandemic were no longer impacting our network of franchised and licensed retail stores and many of our locations had returned to, or exceeded, pre-pandemic levels. These increases were partially offset by the costs associated with the contested solicitation of proxies incurred during FY 2022 with no comparable costs in FY 2021. The decrease in loss from operations and net loss was due primarily to recovery from the COVID-19 pandemic and the associated impact on revenue during FY 2021 partially offset by the costs associated with the contested solicitation of proxies and the associated accrued severance and stock compensation costs during FY 2022.
REVENUES
| |
|
For the Year Ended |
|
|
|
|
|
|
|
|
|
| ($'s in thousands) |
|
February 28, |
|
|
$ |
|
|
% |
|
| |
|
2022 |
|
|
2021 |
|
|
Change |
|
|
Change |
|
| Factory sales |
|
$ |
22,374.2 |
|
|
$ |
17,321.0 |
|
|
$ |
5,053.2 |
|
|
|
29.2 |
% |
| Retail sales |
|
|
1,160.3 |
|
|
|
896.8 |
|
|
|
263.5 |
|
|
|
29.4 |
% |
| Franchise fees |
|
|
179.7 |
|
|
|
178.1 |
|
|
|
1.6 |
|
|
|
0.9 |
% |
| Royalty and marketing fees |
|
|
5,774.4 |
|
|
|
3,367.3 |
|
|
|
2,407.1 |
|
|
|
71.5 |
% |
| Total |
|
$ |
29,488.6 |
|
|
$ |
21,763.2 |
|
|
$ |
7,725.4 |
|
|
|
35.5 |
% |
Factory Sales
The increase in factory sales for FY 2022 compared to FY 2021 was primarily due to a 70.0% increase in sales of product to our network of franchised and licensed retail stores partially offset by a 40.7% decrease in shipments of product to customers outside our network of franchised retail stores. Purchases by the Company’s largest customer, Edible, during FY 2022 were approximately $1.7 million, or 5.3% of the Company’s revenues, compared to $3.5 million, or 15.1% of the Company’s revenues during FY 2021. The increase in sales of product to our network of franchised and licensed retail stores was primarily the result of the COVID-19 pandemic and the associated public health measures in place during FY 2021, which significantly reduced traffic in our stores. During FY 2022 most of the disruptions experienced as a result of the COVID-19 pandemic were no longer impacting our network of franchised and licensed retail stores and many of our locations had returned to, or exceeded, pre-pandemic levels. During FY 2022, certain disagreements arose between RMCF and Edible related to the strategic alliance and ecommerce agreements resulting in termination of the agreements in FY 2023, as described herein. There can be no assurance historical revenue levels will be indicative of future revenues. Same store pounds purchased by domestic franchise and licensed locations increased 11.7% during FY 2022 when compared to FY 2020 (the most recent comparable period prior to the business disruptions of COVID-19).
Retail Sales
The increase in retail sales for FY 2022 compared to FY 2021 was primarily due to all of our Company-owned stores being open during FY 2022 compared to the closure or limited operations of all of our Company-owned stores for much of FY 2021. The closure or limited operations of our Company-owned stores in the prior year period was the result of the COVID-19 pandemic and the associated public health measures in place during FY 2021. As of February 28, 2022 most Company-owned stores had resumed full operations following COVID-19 related closure.
Royalties, Marketing Fees and Franchise Fees
The increase in royalty and marketing fees during FY 2022 compared to FY 2021 was primarily due to the majority of our franchise locations having resumed normal operations during FY 2022, due to the relaxing of restrictions related to the COVID-19 pandemic and the associated public health measures in place during FY 2021 as well as the rollout of vaccines at the beginning of FY 2022. Nearly all of our franchised locations experienced reduced operations and periods of full closure during FY 2021. Same store sales at domestic franchise locations increased 23.6% in FY 2022 when compared to FY 2020 (the most recent comparable period prior to the business disruptions of COVID-19).
Franchise fees were approximately unchanged during FY 2022 compared to FY 2021.
COSTS AND EXPENSES
Cost of Sales
| |
|
For the Year Ended |
|
|
|
|
|
|
|
|
|
| |
|
February 28, |
|
|
$ |
|
|
% |
|
| ($'s in thousands) |
|
2022 |
|
|
2021 |
|
|
Change |
|
|
Change |
|
| |
|
|
|
|
|
|
|
|
|
|
|
|
|
|
|
|
| Cost of sales - factory |
|
$ |
18,153.8 |
|
|
$ |
15,473.8 |
|
|
$ |
2,680.0 |
|
|
|
17.3 |
% |
| Cost of sales - retail |
|
|
456.9 |
|
|
|
324.7 |
|
|
|
132.2 |
|
|
|
40.7 |
% |
| Franchise costs |
|
|
1,915.0 |
|
|
|
1,443.8 |
|
|
|
471.2 |
|
|
|
32.6 |
% |
| Sales and marketing |
|
|
1,474.8 |
|
|
|
1,623.2 |
|
|
|
(148.4 |
) |
|
|
(9.1 |
)% |
| General and administrative |
|
|
7,456.3 |
|
|
|
4,938.1 |
|
|
|
2,518.2 |
|
|
|
51.0 |
% |
| Retail operating |
|
|
606.9 |
|
|
|
478.6 |
|
|
|
128.3 |
|
|
|
26.8 |
% |
| Total |
|
$ |
30,063.7 |
|
|
$ |
24,282.2 |
|
|
$ |
5,781.5 |
|
|
|
23.8 |
% |
| Gross Margin |
|
For the Year Ended |
|
|
|
|
|
|
|
|
|
| |
|
February 28, |
|
|
$ |
|
|
% |
|
| ($'s in thousands) |
|
2022 |
|
|
2021 |
|
|
Change |
|
|
Change |
|
| |
|
|
|
|
|
|
|
|
|
|
|
|
|
|
|
|
| Factory gross margin |
|
$ |
4,220.4 |
|
|
$ |
1,847.2 |
|
|
$ |
2,373.2 |
|
|
|
128.5 |
% |
| Retail gross margin |
|
|
703.4 |
|
|
|
572.1 |
|
|
|
131.3 |
|
|
|
23.0 |
% |
| Total |
|
$ |
4,923.8 |
|
|
$ |
2,419.3 |
|
|
$ |
2,504.5 |
|
|
|
103.5 |
% |
| Gross Margin |
|
For the Year Ended |
|
|
|
|
|
|
|
|
|
| |
|
February 28, |
|
|
% |
|
|
% |
|
| |
|
2022 |
|
|
2021 |
|
|
Change |
|
|
Change |
|
| (Percent) |
|
|
|
|
|
|
|
|
|
|
|
|
|
|
|
|
| Factory gross margin |
|
|
18.9 |
% |
|
|
10.7 |
% |
|
|
8.2 |
% |
|
|
76.6 |
% |
| Retail gross margin |
|
|
60.6 |
% |
|
|
63.8 |
% |
|
|
(3.2 |
)% |
|
|
(5.0 |
)% |
| Total |
|
|
20.9 |
% |
|
|
13.3 |
% |
|
|
7.6 |
% |
|
|
57.1 |
% |
| Adjusted Gross Margin |
|
For the Year Ended |
|
|
|
|
|
|
|
|
|
| (a non-GAAP measure) |
|
February 28, |
|
|
$ |
|
|
% |
|
| ($'s in thousands) |
|
2022 |
|
|
2021 |
|
|
Change |
|
|
Change |
|
| |
|
|
|
|
|
|
|
|
|
|
|
|
|
|
|
|
| Factory gross margin |
|
$ |
4,220.4 |
|
|
$ |
1,847.2 |
|
|
$ |
2,373.2 |
|
|
|
128.5 |
% |
| Plus: depreciation and amortization |
|
|
620.8 |
|
|
|
625.5 |
|
|
|
(4.7 |
) |
|
|
(0.8 |
)% |
| Factory adjusted gross margin (non-GAAP measure) |
|
|
4,841.2 |
|
|
|
2,472.7 |
|
|
|
2,368.5 |
|
|
|
95.8 |
% |
| Retail gross margin |
|
|
703.4 |
|
|
|
572.1 |
|
|
|
131.3 |
|
|
|
23.0 |
% |
| Total Adjusted Gross Margin (non-GAAP measure) |
|
$ |
5,544.6 |
|
|
$ |
3,044.8 |
|
|
$ |
2,499.8 |
|
|
|
82.1 |
% |
| |
|
|
|
|
|
|
|
|
|
|
|
|
|
|
|
|
| Factory adjusted gross margin (non-GAAP measure) |
|
|
21.6 |
% |
|
|
14.3 |
% |
|
|
7.3 |
% |
|
|
51.0 |
% |
| Retail gross margin |
|
|
60.6 |
% |
|
|
63.8 |
% |
|
|
(3.2 |
)% |
|
|
(5.0 |
)% |
| Total Adjusted Gross Margin (non-GAAP measure) |
|
|
23.6 |
% |
|
|
16.7 |
% |
|
|
6.9 |
% |
|
|
41.3 |
% |
Non-GAAP Measures
In addition to the results provided in accordance with U.S. GAAP, we provide certain non-GAAP measures, which present results on an adjusted basis. These are supplemental measures of performance that are not required by or presented in accordance with U.S. GAAP. Adjusted gross margin and factory adjusted gross margin are non-GAAP measures. Adjusted gross margin is equal to the sum of our factory adjusted gross margin plus our retail gross margin calculated in accordance with GAAP. Factory adjusted gross margin is equal to factory gross margin plus depreciation and amortization expense. We believe adjusted gross margin and factory adjusted gross margin are helpful in understanding our past performance as a supplement to gross margin, factory gross margin and other performance measures calculated in conformity with GAAP. We believe that adjusted gross margin and factory adjusted gross margin are useful to investors because they provide a measure of operating performance and our ability to generate cash that is unaffected by non-cash accounting measures. Additionally, we use adjusted gross margin and factory adjusted gross margin rather than gross margin and factory gross margin to make incremental pricing decisions. Adjusted gross margin and factory adjusted gross margin have limitations as analytical tools because they exclude the impact of depreciation and amortization expense and you should not consider it in isolation or as a substitute for any measure reported under GAAP. Our use of capital assets makes depreciation and amortization expense a necessary element of our costs and our ability to generate income. Due to these limitations, we use adjusted gross margin and factory adjusted gross margin as measures of performance only in conjunction with GAAP measures of performance such as gross margin and factory gross margin.
Cost of Sales and Gross Margin
Factory gross margins increased to 18.9% in FY 2022 compared to a gross margin of 10.7% during FY 2021, due primarily to a 27.4% increase in production volume, higher average sell prices, and the impacts of Employee Retention Credits in FY 2022 compared to FY 2021, partially offset by increased costs of materials and labor. The increase in production volume was in response to a 29.2% increase in factory sales, primarily due to a resumption of normal factory operations during FY 2022 compared to significantly reduced operations during FY 2021. Operations during FY 2021 were lower than historical levels as a result of the impacts of the COVID-19 pandemic. As a result of the decrease in production volume, factory fixed costs, including idle labor, did not decrease proportionate to factory revenue during FY 2021. During FY 2021 the Company incurred approximately $280,000 of production labor costs associated with paying employees who abided by local stay at home orders related to COVID-19 public health measures. This excess capacity cost, in the form of idle labor, was included in cost of sales.
Retail gross margins decreased from 63.8% during FY 2021 to 60.6% during FY 2022. The decrease in retail gross margins was primarily the result of higher costs.
Franchise Costs
The increase in franchise costs in FY 2022 compared to FY 2021 was due primarily to an increase in professional fees, the result of litigation with IC, our licensee in Canada. As a percentage of total royalty and marketing fees and franchise fee revenue, franchise costs decreased to 32.2% in FY 2022 from 40.7% in FY 2021. This decrease as a percentage of royalty, marketing and franchise fees is primarily a result of higher royalty fees partially offset by higher costs.
Sales and Marketing
The decrease in sales and marketing costs during FY 2022 compared to FY 2021 was primarily due to a decrease in online advertising costs.
General and Administrative
The increase in general and administrative costs during FY 2022 compared to FY 2021 is primarily due to costs associated with a stockholder’s contested solicitation of proxies in connection with our 2021 annual meeting of stockholders and the compensation costs associated with the letter agreement between the Company and our former Chief Executive Officer and Chief Financial Officer. These increases were partially offset by a decrease in bad debt expense during FY 2022 compared to FY 2021 and an absence of impairment expense related to certain intangible assets during FY 2022 compared with impairment expense of $533,000 incurred during FY 2021. During FY 2022, the Company incurred approximately $1.7 million of costs associated with the contested solicitation of proxies and $2.0 million in change in control severance expense, compared with no comparable costs incurred in FY 2021. As a percentage of total revenues, general and administrative expenses increased to 25.3% in FY 2022 compared to 22.7% in FY 2021.
Retail Operating Expenses
The increase in retail operating expenses during FY 2022 compared to FY 2021 was a result of the re-opening of all of our Company-owned stores so that all stores were open during FY 2022 compared to the closure or limited operation of all of our Company-owned stores for much of FY 2021. The closure or limited operation of our Company-owned stores was the result of COVID-19 and the associated public health measures in place during the FY 2021. Retail operating expenses, as a percentage of retail sales, decreased from 53.4% during FY 2021 to 52.3% in FY 2022. This decrease is primarily the result of higher retail sales partially offset by higher retail operating expenses.
Depreciation and Amortization
Depreciation and amortization, exclusive of depreciation and amortization included in cost of sales, was $119,000 during FY 2022, a decrease of 21.9% from $153,000 incurred during FY 2021. This decrease was the result of certain assets becoming fully depreciated. Depreciation and amortization included in cost of sales decreased 0.8% from $626,000 during FY 2021 to $621,000 during FY 2022. This decrease was the result of certain assets becoming fully depreciated, partially offset by depreciation related to new assets acquired.
Other Income (Expense)
Other income decreased to $178,000 during FY 2022 compared to other income of $1.6 million during FY 2021. This change was primarily the result of debt forgiveness income during FY 2021 with no comparable amounts realized during FY 2022. Net interest income was $11,000 in FY 2022 compared to net interest expense of $77,000 during FY 2021. This change was primarily the result of the Company’s increased debt as a result of measures taken during the three months ended May 31, 2020 to ensure adequate liquidity during the COVID-19 pandemic. During FY 2021, the Company borrowed $3.4 million from its line of credit and borrowed $1.4 million of loans under the Paycheck Protection Program. The line of credit was paid in full and Paycheck Protection Program loans were fully forgiven during FY 2021.
The Company recognized a gain on insurance recovery of $167,100 during FY 2022, compared with $210,500 recognized during FY 2021. The Company recognized forgiveness of debt of $1.4 million during FY 2021, with no comparable amount recognized during FY 2022.
Income Tax Expense
We realized $17,000 of income tax benefit in FY 2022 on a loss before income taxes of $517,000, compared to an income tax benefit of $745,000 realized in FY 2021 on a loss before income taxes of $1.2 million. The income tax benefit in FY 2021 was primarily the result of debt forgiveness income being realized in FY 2021 with no associated income tax expense and the revaluation of a portion of deferred tax assets as a result of the Company realizing a taxable loss during FY 2021 that can be carried back to prior periods with a higher effective income tax rate. The low effective income tax rate in FY 2022 was primarily the result of differences in the valuation of restricted stock awards and the realization of $155,000 of employee retention credits that reduced the loss that could be carried back to prior periods.
Liquidity and Capital Resources
As of February 28, 2023, working capital was $6.2 million compared with $9.7 million as of February 28, 2022. The decrease in working capital was due primarily to a strategic reduction of inventory on hand commensurate with the current product assortments actively marketed by us and our franchisees. We have historically generated excess operating cash flow.
Cash and cash equivalent balances decreased from $7.6 million as of February 28, 2022 to $4.7 million as of February 28, 2023 as a result of cash used by operating and investing activities. Our current ratio was 2.2 to 1.0 on February 28, 2023 compared to 2.8 to 1.0 on February 28, 2022. We monitor current and anticipated future levels of cash and cash equivalents in relation to anticipated operating, financing and investing requirements.
During FY 2023, we had a consolidated net loss of $5.7 million. Operating activities used cash of $2.1 million, with the principal adjustment to reconcile net income to net cash provided by operating activities being expense associated with establishing a full reserve of deferred tax assets of $722,000, depreciation and amortization of $765,000, provision for obsolete inventory of $732,000 and stock compensation expense of $651,000. During FY 2022, we had a consolidated net loss of $342,000. Operating activities provided cash of $2.9 million, with the principal adjustment to reconcile net income to net cash provided by operating activities being an increase in accrued liabilities of $1.3 million, depreciation and amortization of $740,000 and stock compensation expense of $1.1 million.
During FY 2023, investing activities used cash of $768,000, primarily due to the purchases of property and equipment of $1.0 million, partially offset by investing cash flow from discontinued operations of $197,000. In comparison, investing activities used cash of $605,000 during FY 2022 primarily due to the purchases of property and equipment of $941,000, partially offset by proceeds received from an insurance recovery of $206,000.
There were no cash flows from financing activities during FY 2023 compared to financing activities using $299,000 during the prior year. The change in cash used in financing activities was primarily due to the net settlement of restricted stock units in the prior year with no similar activity in the current year.
Revolving Credit Line
The Company has a $5.0 million credit line for general corporate and working capital purposes, of which $5.0 million was available for borrowing (subject to certain borrowing base limitations) as of February 28, 2023. The credit line is secured by substantially all of the Company’s assets, except retail store assets. Interest on borrowings is at SOFR plus 2.37% (6.92% on February 28, 2023). Additionally, the line of credit is subject to various financial ratio and leverage covenants. On February 28, 2023, the Company was in compliance with all such covenants. The credit line is subject to renewal in September 2023 and the Company believes it is likely to be renewed on terms similar to the current terms.
Contractual Obligations
The table below presents significant contractual obligations of the Company at February 28, 2023.
(Amounts in thousands)
| Contractual Obligations |
|
Total |
|
|
Less than 1 year |
|
|
2-3 Years |
|
|
4-5 years |
|
|
More Than 5 years |
|
| Operating leases |
|
$ |
1,883 |
|
|
$ |
426 |
|
|
$ |
785 |
|
|
$ |
282 |
|
|
$ |
390 |
|
| Purchase contracts |
|
|
384 |
|
|
|
384 |
|
|
|
- |
|
|
|
- |
|
|
|
- |
|
| Other long-term obligations |
|
|
709 |
|
|
|
335 |
|
|
|
342 |
|
|
|
32 |
|
|
|
- |
|
| Total |
|
$ |
2,976 |
|
|
$ |
1,145 |
|
|
$ |
1,127 |
|
|
$ |
314 |
|
|
$ |
390 |
|
The Company made an average of $766,000 per year in capital expenditures during FY 2021 to FY 2023. For FY 2024 the Company anticipates making approximately $2.8 million in capital expenditures. The planned increase is the result of expected investment in machinery and equipment to replace equipment that has reached the end of its useful life.
Impact of Inflation
Inflationary factors such as increases in the costs of ingredients and labor directly affect the Company's operations. Most of the Company's leases provide for cost-of-living adjustments and require it to pay taxes, insurance and maintenance expenses, all of which are subject to inflation. Additionally, the Company’s future lease cost for new facilities may include potentially escalating costs of real estate and construction. There is no assurance that the Company will be able to pass on increased costs to its customers.
Depreciation expense is based on the historical cost to the Company of its fixed assets, and is therefore potentially less than it would be if it were based on the current replacement cost. While property and equipment acquired in prior years will ultimately have to be replaced at higher prices, it is expected that replacement will be a gradual process over many years.
Critical Accounting Estimates
Our discussion and analysis of our financial condition and results of operations are based upon our consolidated financial statements, which have been prepared in accordance with accounting principles generally accepted in the United States of America. The preparation of our consolidated financial statements requires us to make estimates and judgments that affect the reported amounts of assets, liabilities, revenues and expenses and the related disclosures. Estimates and assumptions include, but are not limited to, the carrying value of accounts and notes receivable from franchisees, inventories, the useful lives of fixed assets, goodwill, and other intangible assets, income taxes, contingencies and litigation. We base our estimates on analyses, which form the basis for making judgments about the carrying values of assets and liabilities that are not readily apparent from other sources. Actual results may differ from these estimates.
We believe that the following represent our critical estimates and assumptions used in the preparation of our consolidated financial statements, although not all inclusive.
Accounts and Notes Receivable - In the normal course of business, we extend credit to customers, primarily franchisees, that satisfy pre-defined credit criteria. We believe that we have a limited concentration of credit risk primarily because our receivables are secured by the assets of the franchisees to which we ordinarily extend credit, including, but not limited to, their franchise rights and inventories. An allowance for doubtful accounts is determined through analysis of the aging of accounts receivable, assessments of collectability based on historical trends, and an evaluation of the impact of current and projected economic conditions. The process by which we perform our analysis is conducted on a customer by customer, or franchisee by franchisee, basis and takes into account, among other relevant factors, sales history, outstanding receivables, customer financial strength, as well as customer specific and geographic market factors relevant to projected performance. The Company monitors the collectability of its accounts receivable on an ongoing basis by assessing the creditworthiness of its customers and evaluating the impact of reasonably likely changes in economic conditions that may impact credit risks. Estimates with regard to the collectability of accounts receivable are reasonably likely to change in the future.
During the three years ended February 28, 2023, 2022 and 2021 we recorded expense of $(173,600), $0, and $1,257,010, respectively for potential uncollectible accounts. Write-offs of uncollectible accounts net of recoveries were $45,517, $471,118 and $441,776, respectively, over the same period. The provision for uncollectible accounts is recognized as general and administrative expense in the Statements of Income. Over the past three fiscal years, the allowances for doubtful notes and accounts have ranged from 27.1% to 43.4% of gross receivables.
Revenue Recognition - We recognize revenue on sales of products to franchisees and other customers at the time of delivery. Beginning in FY 2019, upon adoption of ASC 606, the Company began recognizing franchise fees and license fees over the term of the associated agreement, which is generally a period of 10 years. Prior to FY 2019, franchise fee revenue was recognized upon opening of the franchise store, or upon execution of an international license agreement. We recognize a marketing and promotion fee of one percent (1%) of the Rocky Mountain Chocolate Factory stores’ gross retail sales and a royalty fee based on gross retail sales. The Company recognizes no royalty on franchised stores’ retail sales of products purchased from the Company’s manufacturing facility and recognizes a ten percent (10%) royalty on all other sales of product sold at franchise locations including products made in the store.
Inventories - Our inventories are stated at the lower of cost or net realizable value and are reduced for slow-moving, excess, discontinued and shelf-life expired inventories. Our estimate for such reduction is based on our review of inventories on hand compared to estimated future usage and demand for our products. Such review encompasses not only potentially perishable inventories but also specialty packaging, much of it specific to certain holiday seasons. If actual future usage and demand for our products are less favorable than those projected by our review, further inventory adjustments may be required. We closely monitor our inventory, both perishable and non-perishable, and related shelf and product lives. Historically we have experienced low levels of obsolete inventory or returns of products that have exceeded their shelf life. Over the three fiscal years ended February 28, 2023, 2022, and 2021, the Company recorded expense of $732,499, $384,473 and $251,926, respectively, for potential inventory losses, or an average of approximately 2.4% of total cost of sales for that three year period.
Goodwill – Goodwill consists of the excess of purchase price over the fair market value of acquired assets and liabilities. Effective March 1, 2002, under ASC Topic 350, all goodwill with indefinite lives is no longer subject to amortization. ASC Topic 350 requires that an impairment test be conducted annually or in the event of an impairment indicator. Our testing and impairment are described in Note 7 to the financial statements.
Other accounting estimates inherent in the preparation of our consolidated financial statements include estimates associated with its evaluation of the recoverability of deferred tax assets, as well as those used in the determination of liabilities related to litigation and taxation. Various assumptions and other factors underlie the determination of these significant estimates. The process of determining significant estimates is fact specific and takes into account factors such as historical experience, current and expected economic conditions, and product mix. The Company constantly re-evaluates these significant factors and makes adjustments where facts and circumstances dictate. Historically, actual results have not significantly deviated from those determined using the estimates described above.
ITEM 7A. QUANTITATIVE AND QUALITATIVE DISCLOSURES ABOUT MARKET RISK
As a smaller reporting company, we are not required to provide the information required by this Item.
ITEM 8. FINANCIAL STATEMENTS AND SUPPLEMENTARY DATA
INDEX TO FINANCIAL STATEMENTS
Report of Independent Registered Public Accounting Firm
To the Stockholders and Board of Directors
Rocky Mountain Chocolate Factory, Inc.
Opinion on the Financial Statements
We have audited the accompanying consolidated balance sheets of Rocky Mountain Chocolate Factory, Inc. (the “Company”) as of February 28, 2023 and 2022, the related consolidated statements of operations, changes in stockholders' equity, and cash flows for each of the years in the three-year period ended February 28, 2023, and the related notes (collectively referred to as the “financial statements”). In our opinion, the financial statements referred to above present fairly, in all material respects, the financial position of the Company as of February 28, 2023 and 2022, and the results of its operations and its cash flows for each of the years in the three-year period ended February 28, 2023, in conformity with accounting principles generally accepted in the United States of America.
Basis for Opinion
The Company's management is responsible for these financial statements. Our responsibility is to express an opinion on the Company’s financial statements based on our audits. We are a public accounting firm registered with the Public Company Accounting Oversight Board (United States) (“PCAOB”) and are required to be independent with respect to the Company in accordance with the U.S. federal securities laws and the applicable rules and regulations of the Securities and Exchange Commission and the PCAOB.
We conducted our audits in accordance with the standards of the PCAOB. Those standards require that we plan and perform the audit to obtain reasonable assurance about whether the financial statements are free of material misstatement, whether due to error or fraud. The Company is not required to have, nor were we engaged to perform, an audit of its internal control over financial reporting. As part of our audits, we are required to obtain an understanding of internal control over financial reporting but not for the purpose of expressing an opinion on the effectiveness of the Company's internal control over financial reporting. Accordingly, we express no such opinion.
Our audits included performing procedures to assess the risks of material misstatement of the financial statements, whether due to error or fraud, and performing procedures that respond to those risks. Such procedures included examining, on a test basis, evidence regarding the amounts and disclosures in the financial statements. Our audits also included evaluating the accounting principles used and significant estimates made by management, as well as evaluating the overall presentation of the financial statements. We believe that our audits provide a reasonable basis for our opinion.
Critical Audit Matters
Critical audit matters are matters arising from the current period audit of the financial statements that were communicated or required to be communicated to the audit committee and that: (1) relate to accounts or disclosures that are material to the financial statements and (2) involved our especially challenging, subjective, or complex judgments. We determined that there are no critical audit matters.
/s/ PLANTE & MORAN, PLLC
We have served as the Company’s auditor since 2004.
Cleveland, Ohio
May 30, 2023
ROCKY MOUNTAIN CHOCOLATE FACTORY, INC. AND SUBSIDIARIES
CONSOLIDATED STATEMENTS OF OPERATIONS
| | | FOR THE YEARS ENDED FEBRUARY 28, | |
| | | 2023 | | | 2022 | | | 2021 | |
| Revenues | | | | | | | | | | | | |
| Sales | | $ | 24,456,910 | | | $ | 23,534,470 | | | $ | 18,217,794 | |
| Franchise and royalty fees | | | 5,975,442 | | | | 5,954,078 | | | | 3,545,387 | |
| Total Revenue | | | 30,432,352 | | | | 29,488,548 | | | | 21,763,181 | |
| | | | | | | | | | | | | |
| Costs and Expenses | | | | | | | | | | | | |
| Cost of sales | | | 20,455,373 | | | | 18,610,739 | | | | 15,798,557 | |
| Franchise costs | | | 1,825,783 | | | | 1,914,944 | | | | 1,443,807 | |
| Sales and marketing | | | 2,060,215 | | | | 1,474,807 | | | | 1,623,173 | |
| General and administrative | | | 10,325,633 | | | | 7,456,314 | | | | 4,938,095 | |
| Retail operating | | | 537,482 | | | | 606,889 | | | | 478,561 | |
| Depreciation and amortization, exclusive of depreciation and amortization expense of $646,394, $620,798, and $625,526, respectively, included in cost of sales | | | 118,869 | | | | 119,377 | | | | 152,921 | |
| Costs associated with Company-owned store closures | | | - | | | | - | | | | 57,100 | |
| Total costs and expenses | | | 35,323,355 | | | | 30,183,070 | | | | 24,492,214 | |
| | | | | | | | | | | | | |
| Loss from Operations | | | (4,891,003 | ) | | | (694,522 | ) | | | (2,729,033 | ) |
| | | | | | | | | | | | | |
| Other Income (Expense) | | | | | | | | | | | | |
| Interest expense | | | (10,431 | ) | | | - | | | | (93,897 | ) |
| Interest income | | | 26,921 | | | | 10,870 | | | | 16,982 | |
| Gain on insurance recovery | | | - | | | | 167,123 | | | | 210,464 | |
| Paycheck Protection Program | | | - | | | | - | | | | 1,440,267 | |
| Other income (expense), net | | | 16,490 | | | | 177,993 | | | | 1,573,816 | |
| | | | | | | | | | | | | |
| Loss Before Income Taxes | | | (4,874,513 | ) | | | (516,529 | ) | | | (1,155,217 | ) |
| | | | | | | | | | | | | |
| Income Tax Provision | | | 613,843 | | | | (16,812 | ) | | | (745,495 | ) |
| | | | | | | | | | | | | |
| Net Loss from Continuing Operations | | | (5,488,356 | ) | | | (499,717 | ) | | | (409,722 | ) |
| | | | | | | | | | | | | |
| Earnings (loss) from discontinued operations, net of tax | | | (192,422 | ) | | | 158,020 | | | | (490,055 | ) |
| | | | | | | | | | | | | |
| Consolidated Net Loss | | $ | (5,680,778 | ) | | $ | (341,697 | ) | | $ | (899,777 | ) |
| | | | | | | | | | | | | |
| Basic Loss per Common Share | | | | | | | | | | | | |
| Loss from continuing operations | | $ | (0.88 | ) | | $ | (0.08 | ) | | $ | (0.07 | ) |
| Earnings (loss) from discontinued operations | | | (0.03 | ) | | | 0.02 | | | | (0.08 | ) |
| Net Earnings | | $ | (0.91 | ) | | $ | (0.06 | ) | | $ | (0.15 | ) |
| | | | | | | | | | | | | |
| Diluted Loss per Common Share | | | | | | | | | | | | |
| Loss from continuing operations | | $ | (0.88 | ) | | $ | (0.08 | ) | | $ | (0.07 | ) |
| Earnings (loss) from discontinued operations | | | (0.03 | ) | | | 0.02 | | | $ | (0.08 | ) |
| Net Earnings | | $ | (0.91 | ) | | $ | (0.06 | ) | | $ | (0.15 | ) |
| | | | | | | | | | | | | |
| Weighted Average Common Shares Outstanding - Basic | | | 6,226,279 | | | | 6,140,687 | | | | 6,067,461 | |
| Dilutive Effect of Employee Stock Awards | | | - | | | | - | | | | - | |
| Weighted Average Common Shares Outstanding - Diluted | | | 6,226,279 | | | | 6,140,687 | | | | 6,067,461 | |
The accompanying notes are an integral part of these consolidated financial statements.
ROCKY MOUNTAIN CHOCOLATE FACTORY, INC. AND SUBSIDIARIES
CONSOLIDATED BALANCE SHEETS
| | | AS OF FEBRUARY 28, | |
| | | 2023 | | | 2022 | |
| Assets | | | | | | | | |
| Current Assets | | | | | | | | |
| Cash and cash equivalents | | $ | 4,717,068 | | | $ | 7,587,374 | |
| Accounts receivable, less allowance for doubtful accounts of $666,315 and $804,815, respectively | | | 2,055,694 | | | | 1,905,836 | |
| Notes receivable, current portion, less current portion of the valuation allowance of $35,173 and $47,228, respectively | | | 23,698 | | | | 8,680 | |
| Refundable income taxes | | | 344,885 | | | | 736,528 | |
| Inventories | | | 3,639,780 | | | | 4,297,883 | |
| Other | | | 340,847 | | | | 334,801 | |
| Current assets held for sale | | | 83,004 | | | | 126,864 | |
| Total current assets | | | 11,204,976 | | | | 14,997,966 | |
| Property and Equipment, Net | | | 5,710,739 | | | | 5,451,188 | |
| Other Assets | | | | | | | | |
| Notes receivable, less current portion and valuation allowance of $38,778 and $65,059, respectively | | | 94,076 | | | | - | |
| Goodwill, net | | | 575,608 | | | | 729,701 | |
| Intangible assets, net | | | 265,927 | | | | 294,832 | |
| Deferred income taxes | | | | | | | 722,163 | |
| Lease right of use asset | | | 2,355,601 | | | | 1,771,034 | |
| Other | | | 14,054 | | | | 28,087 | |
| Long-term assets held for sale | | | 1,765,846 | | | | 2,885,790 | |
| Total other assets | | | 5,071,112 | | | | 6,431,607 | |
| Total Assets | | $ | 21,986,827 | | | $ | 26,880,761 | |
| Liabilities and Stockholders' Equity | | | | | | | | |
| Current Liabilities | | | | | | | | |
| Accounts payable | | $ | 2,189,760 | | | $ | 1,496,008 | |
| Accrued salaries and wages | | | 978,606 | | | | 2,076,118 | |
| Gift card liabilities | | | 592,932 | | | | 574,883 | |
| Other accrued expenses | | | 162,346 | | | | 224,256 | |
| Contract liabilities | | | 161,137 | | | | 171,327 | |
| Lease liability | | | 746,506 | | | | 595,897 | |
| Current liabilities held for sale | | | 178,939 | | | | 173,243 | |
| Total current liabilities | | | 5,010,226 | | | | 5,311,732 | |
| Lease Liability, Less Current Portion | | | 1,640,017 | | | | 1,218,256 | |
| Contract Liabilities, Less Current Portion | | | 782,278 | | | | 791,245 | |
| Long-term liabilities - held for sale | | | 184,142 | | | | 159,602 | |
| Commitments and Contingencies | | | | | | | | |
| Stockholders' Equity | | | | | | | | |
| Preferred stock, $.001 par value per share; 250,000 authorized; -0- shares issued and outstanding | | | - | | | | - | |
| Common stock, $.001 par value, 46,000,000 shares authorized, 6,257,137 shares and 6,186,356 shares issued and outstanding, respectively | | | 6,257 | | | | 6,186 | |
| Additional paid-in capital | | | 9,457,875 | | | | 8,806,930 | |
| Retained earnings | | | 4,906,032 | | | | 10,586,810 | |
| Total stockholders' equity | | | 14,370,164 | | | | 19,399,926 | |
| Total Liabilities and Stockholders' Equity | | $ | 21,986,827 | | | $ | 26,880,761 | |
The accompanying notes are an integral part of these consolidated financial statements.
ROCKY MOUNTAIN CHOCOLATE FACTORY, INC. AND SUBSIDIARIES
CONSOLIDATED STATEMENTS OF CHANGES IN STOCKHOLDERS' EQUITY
| |
FOR THE YEARS ENDED FEBRUARY 28, |
|
| |
2023 |
|
2022 |
|
2021 |
|
| Common Stock |
|
|
|
|
|
|
|
|
|
| Balance at beginning of year |
$ |
6,186 |
|
$ |
6,074 |
|
$ |
6,020 |
|
| Issuance of common stock, vesting of restricted stock units and other, net of shares withheld |
|
- |
|
|
9 |
|
|
- |
|
| Equity compensation, restricted stock units, net of shares withheld |
|
71 |
|
|
103 |
|
|
54 |
|
| Balance at end of year |
|
6,257 |
|
|
6,186 |
|
|
6,074 |
|
| |
|
|
|
|
|
|
|
|
|
| Additional Paid-In Capital |
|
|
|
|
|
|
|
|
|
| Balance at beginning of year |
|
8,806,930 |
|
|
7,971,712 |
|
|
7,459,931 |
|
| Issuance of common stock, vesting of restricted stock units and other, net of shares withheld |
|
- |
|
|
46,601 |
|
|
- |
|
| Equity compensation, restricted stock units, net of shares withheld |
|
650,945 |
|
|
788,617 |
|
|
511,781 |
|
| Balance at end of year |
|
9,457,875 |
|
|
8,806,930 |
|
|
7,971,712 |
|
| |
|
|
|
|
|
|
|
|
|
| Retained Earnings |
|
|
|
|
|
|
|
|
|
| Balance at beginning of year |
|
10,586,810 |
|
|
10,989,783 |
|
|
11,889,560 |
|
| Net (loss) income attributable to RMCF stockholders |
|
(5,680,778 |
) |
|
(341,697 |
) |
|
(899,777 |
) |
| Cash dividends declared |
|
- |
|
|
- |
|
|
- |
|
| Redemption of outstanding preferred stock purchase rights |
|
- |
|
|
(61,276 |
) |
|
- |
|
| Balance at end of year |
|
4,906,032 |
|
|
10,586,810 |
|
|
10,989,783 |
|
| |
|
|
|
|
|
|
|
|
|
| Total Stockholders' Equity |
|
14,370,164 |
|
|
19,399,926 |
|
|
18,967,569 |
|
| |
|
|
|
|
|
|
|
|
|
| Common Shares |
|
|
|
|
|
|
|
|
|
| Balance at beginning of year |
|
6,186,356 |
|
|
6,074,293 |
|
|
6,019,532 |
|
| Issuance of common stock, vesting of restricted stock units and other, net of shares withheld |
|
- |
|
|
9,000 |
|
|
- |
|
| Equity compensation, restricted stock units, net of shares withheld |
|
70,781 |
|
|
103,063 |
|
|
54,761 |
|
| Balance at end of year |
|
6,257,137 |
|
|
6,186,356 |
|
|
6,074,293 |
|
The accompanying notes are an integral part of these consolidated financial statements.
ROCKY MOUNTAIN CHOCOLATE FACTORY, INC. AND SUBSIDIARIES
CONSOLIDATED STATEMENTS OF CASH FLOWS
| |
|
FOR THE YEARS ENDED FEBRUARY 28, |
|
| |
|
2023 |
|
|
2022 |
|
|
2021 |
|
| Cash Flows From Operating Activities |
|
|
|
|
|
|
|
|
|
|
|
|
| Net (Loss) Income |
|
$ |
(5,680,778 |
) |
|
$ |
(341,697 |
) |
|
$ |
(899,777 |
) |
| Less: Net (Loss) Income from discontinued operations, net of tax |
|
|
(192,422 |
) |
|
|
158,020 |
|
|
|
(490,055 |
) |
| Net (Loss) Income from continuing operations |
|
|
(5,488,356 |
) |
|
|
(499,717 |
) |
|
|
(409,722 |
) |
| Adjustments to reconcile net income (loss) to net cash provided by operating activities: |
|
|
|
|
|
|
|
|
|
|
|
|
| Depreciation and amortization |
|
|
765,263 |
|
|
|
740,175 |
|
|
|
778,447 |
|
| Provision for obsolete inventory |
|
|
732,499 |
|
|
|
384,473 |
|
|
|
262,156 |
|
| Provision for loss on accounts and notes receivable |
|
|
(277,000 |
) |
|
|
- |
|
|
|
1,241,762 |
|
| Asset impairment and store closure losses |
|
|
84,183 |
|
|
|
- |
|
|
|
533,343 |
|
| Loss (gain) on sale or disposal of property and equipment |
|
|
11,958 |
|
|
|
(159,129 |
) |
|
|
(368,037 |
) |
| Forgiveness of Paycheck Protection Program |
|
|
- |
|
|
|
- |
|
|
|
(1,429,500 |
) |
| Expense recorded for stock compensation |
|
|
651,016 |
|
|
|
1,073,115 |
|
|
|
511,835 |
|
| Deferred income taxes |
|
|
722,163 |
|
|
|
(267,576 |
) |
|
|
(496,491 |
) |
| Changes in operating assets and liabilities: |
|
|
|
|
|
|
|
|
|
|
|
|
| Accounts receivable |
|
|
82,050 |
|
|
|
46,311 |
|
|
|
954,454 |
|
| Refundable income taxes |
|
|
391,643 |
|
|
|
37,999 |
|
|
|
(356,208 |
) |
| Inventories |
|
|
(70,069 |
) |
|
|
(581,433 |
) |
|
|
(634,458 |
) |
| Other current assets |
|
|
(7,246 |
) |
|
|
(122,647 |
) |
|
|
196,088 |
|
| Accounts payable |
|
|
661,111 |
|
|
|
200,557 |
|
|
|
(815,094 |
) |
| Accrued liabilities |
|
|
(1,163,216 |
) |
|
|
1,332,993 |
|
|
|
24,105 |
|
| Contract liabilities |
|
|
5,384 |
|
|
|
26,321 |
|
|
|
(19,042 |
) |
| Net cash (used in) provided by operating activities of continuing operations |
|
|
(2,898,617 |
) |
|
|
2,211,442 |
|
|
|
(26,362 |
) |
| Net cash provided by operating activities of discontinued operations |
|
|
796,126 |
|
|
|
646,712 |
|
|
|
93,708 |
|
| Net cash (used in) provided by operating activities |
|
|
(2,102,491 |
) |
|
|
2,858,154 |
|
|
|
67,346 |
|
| |
|
|
|
|
|
|
|
|
|
|
|
|
| Cash Flows from Investing Activities |
|
|
|
|
|
|
|
|
|
|
|
|
| Addition to notes receivable |
|
|
(64,621 |
) |
|
|
- |
|
|
|
- |
|
| Proceeds received on notes receivable |
|
|
62,411 |
|
|
|
109,809 |
|
|
|
73,699 |
|
| Purchase of intangible assets |
|
|
- |
|
|
|
- |
|
|
|
(99,048 |
) |
| Proceeds from insurance recovery |
|
|
- |
|
|
|
206,336 |
|
|
|
304,962 |
|
| Proceeds from the sale or distribution of assets |
|
|
27,289 |
|
|
|
2,693 |
|
|
|
- |
|
| Purchases of property and equipment |
|
|
(1,000,015 |
) |
|
|
(941,327 |
) |
|
|
(149,517 |
) |
| (Increase) decrease in other assets |
|
|
10,000 |
|
|
|
(10,000 |
) |
|
|
(207,761 |
) |
| Net cash used in by investing activities of continuing operations |
|
|
(964,936 |
) |
|
|
(632,489 |
) |
|
|
(77,665 |
) |
| Net cash provided by investing activities of discontinued operations |
|
|
197,121 |
|
|
|
27,491 |
|
|
|
6,671 |
|
| Net cash used in investing activities |
|
|
(767,815 |
) |
|
|
(604,998 |
) |
|
|
(70,994 |
) |
| |
|
|
|
|
|
|
|
|
|
|
|
|
| Cash Flows from Financing Activities |
|
|
|
|
|
|
|
|
|
|
|
|
| Repurchase of common stock through net settlement of restricted stock units |
|
|
- |
|
|
|
(237,785 |
) |
|
|
- |
|
| Proceeds from Paycheck Protection Program |
|
|
- |
|
|
|
- |
|
|
|
1,429,500 |
|
| Dividends paid and redemption of outstanding preferred stock purchase rights |
|
|
- |
|
|
|
(61,276 |
) |
|
|
(722,344 |
) |
| Net cash (used in) provided by financing activities of continuing operations |
|
|
- |
|
|
|
(299,061 |
) |
|
|
707,156 |
|
| Net cash provided by financing activities of discontinued operations |
|
|
- |
|
|
|
- |
|
|
|
107,700 |
|
| Net cash provided by (used in) financing activities |
|
|
- |
|
|
|
(299,061 |
) |
|
|
814,856 |
|
| |
|
|
|
|
|
|
|
|
|
|
|
|
| Net Increase (Decrease) in Cash and Cash Equivalents |
|
|
(2,870,306 |
) |
|
|
1,954,095 |
|
|
|
811,208 |
|
| |
|
|
|
|
|
|
|
|
|
|
|
|
| Cash and Cash Equivalents, Beginning of Period |
|
|
7,587,374 |
|
|
|
5,633,279 |
|
|
|
4,822,071 |
|
| |
|
|
|
|
|
|
|
|
|
|
|
|
| Cash and Cash Equivalents, End of Period |
|
$ |
4,717,068 |
|
|
$ |
7,587,374 |
|
|
$ |
5,633,279 |
|
The accompanying notes are an integral part of these consolidated financial statements.
ROCKY MOUNTAIN CHOCOLATE FACTORY, INC. AND SUBSIDIARIES
NOTES TO CONSOLIDATED FINANCIAL STATEMENTS
NOTE 1 - NATURE OF OPERATIONS AND SUMMARY OF SIGNIFICANT ACCOUNTING POLICIES
Nature of Operations
The accompanying consolidated financial statements include the accounts of Rocky Mountain Chocolate Factory, Inc., a Delaware corporation, its wholly-owned subsidiaries, Rocky Mountain Chocolate Factory, Inc. (a Colorado corporation), Aspen Leaf Yogurt, LLC (“ALY”), U-Swirl International, Inc. (“U-Swirl”), and U-Swirl, Inc. (“SWRL”) (collectively, the “Company” or “RMCF”).
The Company is an international franchisor, confectionery manufacturer and retail operator. Founded in 1981, the Company is headquartered in Durango, Colorado and manufactures an extensive line of premium chocolate candies and other confectionery products. The Company also sells its candy in select locations outside of its system of retail stores.
On February 24, 2023 the Company entered into an agreement to sell its three Company-owned U-Swirl locations. Separately, on May 1, 2023, subsequent to the 2023 fiscal year end, the Company entered into an agreement to sell its franchise rights and intangible assets related to U-Swirl and associated brands. As a result, the activities of the Company’s U-Swirl subsidiary that have historically been reported in the U-Swirl segment have been reported as discontinued operations. See Note 20 –Discontinued Operations in the Notes to Consolidated Financial Statements for additional information regarding the Company's discontinued operations, including net sales, operating earnings and total assets by segment. The Company’s financial statements reflect continuing operations only, unless otherwise noted.
The Company’s revenues are currently derived from three principal sources: sales to franchisees and others of chocolates and other confectionery products manufactured by the Company; the collection of initial franchise fees and royalties from franchisees’ sales; and sales at Company-owned stores of chocolates and other confectionery products.
In FY 2020 and early FY 2021 we entered into a long-term strategic alliance and ecommerce agreements, respectively, with Edible Arrangements®, LLC and its affiliates (“Edible”), whereby it was intended that we would become the exclusive provider of certain branded chocolate products to Edible, its affiliates and its franchisees. Under the strategic alliance, Rocky Mountain Chocolate Factory branded products were intended to be available for purchase both on Edible’s website as well as through over 1,000 franchised Edible locations nationwide. In addition, due to Edible’s significant e-commerce expertise and scale, we have also executed an ecommerce licensing agreement with Edible, whereby Edible was expected to sell a wide variety of chocolates, candies and other confectionery products produced by the Company or its franchisees through Edible’s websites. During FY 2022 certain disagreements arose between RMCF and Edible related to the strategic alliance and ecommerce agreements. On November 1, 2022, the Company sent a formal notice to Edible, terminating the Exclusive Supplier Operating Agreement, dated December 20, 2019 (“Exclusive Supplier Agreement”), by and between the Company and Edible, and the Ecommerce Licensing Agreement, dated March 16, 2020 (“Licensing Agreement”), by and between the Company and Edible. Subsequent to the termination of the Supplier Agreement and Licensing Agreement, the Company has no remaining material obligations under the Strategic Alliance Agreement, dated as of December 20, 2019, by and among the Company, Farids & Co. LLC and Edible; the Common Stock Purchase Warrant, dated December 20, 2019, issued to Edible; and the Indemnification Letter Agreement, dated March 16, 2020, by and between the Company and Edible. Purchases by Edible during FY 2023, 2022 and 2021 were approximately $557,000, $1.7 million and $3.5 million, or 1.8%, 5.8% and 16.1% of the Company’s revenues, respectively.
The following table summarizes the number of stores operating under the Rocky Mountain Chocolate Factory brand at February 28, 2023:
| | | Stores Open at 2/28/2022 | | | Opened | | | Closed | | | Sold | | | Stores Open at 2/28/2023 | | | Sold, Not Yet Open | | | Total | |
| Rocky Mountain Chocolate Factory | | | | | | | | | | | | | | | | | | | | | | | | | | | | |
| Company-owned stores | | | 2 | | | | - | | | | - | | | | (1 | ) | | | 1 | | | | - | | | | 1 | |
| Franchise stores - Domestic stores and kiosks | | | 154 | | | | 5 | | | | (7 | ) | | | 1 | | | | 153 | | | | 6 | | | | 159 | |
| International license stores | | | 5 | | | | - | | | | (1 | ) | | | - | | | | 4 | | | | 1 | | | | 5 | |
| Cold Stone Creamery - co-branded | | | 97 | | | | 7 | | | | (3 | ) | | | - | | | | 101 | | | | - | | | | 101 | |
| U-Swirl - co-branded | | | 9 | | | | 2 | | | | (1 | ) | | | - | | | | 10 | | | | - | | | | 10 | |
| Total | | | 267 | | | | | | | | | | | | | | | | 269 | | | | 7 | | | | 276 | |
ROCKY MOUNTAIN CHOCOLATE FACTORY, INC. AND SUBSIDIARIES
NOTES TO CONSOLIDATED FINANCIAL STATEMENTS-(Continued)
Consolidation
Management accounts for the activities of the Company and its subsidiaries, and the accompanying consolidated financial statements include the accounts of the Company and its subsidiaries. All intercompany balances and transactions have been eliminated in consolidation.
Cash Equivalents
The Company considers all highly liquid instruments purchased with an original maturity of three months or less to be cash equivalents. The Company continually monitors its positions with, and the credit quality of, the financial institutions with which it invests. As of the balance sheet date, and periodically throughout the year, the Company has maintained balances in various operating accounts in excess of federally insured limits. This amount was approximately $4.2 million on February 28, 2023.
Accounts and Notes Receivable
In the normal course of business, the Company extends credit to customers, primarily franchisees that satisfy pre-defined credit criteria. The Company believes that it has a limited concentration of credit risk primarily because its receivables are secured by the assets of the franchisees to which the Company ordinarily extends credit, including, but not limited to, their franchise rights and inventories. An allowance for doubtful accounts is determined through analysis of the aging of accounts receivable, assessments of collectability based on historical trends, and an evaluation of the impact of current and projected economic conditions. The process by which the Company performs its analysis is conducted on a customer by customer, or franchisee by franchisee, basis and takes into account, among other relevant factors, sales history, outstanding receivables, customer financial strength, as well as customer specific and geographic market factors relevant to projected performance. The Company monitors the collectability of its accounts receivable on an ongoing basis by assessing the credit worthiness of its customers and evaluating the impact of reasonably likely changes in economic conditions that may impact credit risks. Estimates with regard to the collectability of accounts receivable are reasonably likely to change in the future. On February 28, 2023, the Company had $191,725 of notes receivable outstanding and an allowance for doubtful accounts of $73,951 associated with these notes, compared to $120,967 of notes receivable outstanding and an allowance for doubtful accounts of $112,287 on February 28, 2022. The notes require monthly payments and bear interest rates ranging from 4.5% to 7.0%. The notes mature through December 2027 and all of the notes receivable are secured by the assets of the location. The Company may experience the failure of its wholesale customers, including its franchisees, to whom it extends credit to pay amounts owed to the Company on time, or at all. As of March 1 2021, the Company had $1,952,147 of accounts receivable.
Inventories
Inventories are stated at the lower of cost or net realizable value, which is adjusted for obsolete, damaged and excess inventories to the lower of cost or net realizable value based on actual differences. The inventory value is determined through analysis of items held in inventory, and, if the recorded value is higher than the net realizable value, the Company records an expense to reduce inventory to its actual net realizable value. The process by which the Company performs its analysis is conducted on an item by item basis and takes into account, among other relevant factors, net realizable value, sales history and future sales potential. Cost is determined using the first-in, first-out method.
Property and Equipment and Other Assets
Property and equipment are recorded at cost. Depreciation and amortization are computed using the straight-line method based upon the estimated useful life of the asset, which ranges from five to thirty-nine years. Leasehold improvements are amortized on the straight-line method over the lives of the respective leases or the service lives of the improvements, whichever is shorter.
The Company reviews its long-lived assets through analysis of estimated fair value, including identifiable intangible assets, whenever events or changes indicate the carrying amount of such assets may not be recoverable.
Income Taxes
The Company provides for income taxes pursuant to the liability method. The liability method requires recognition of deferred income taxes based on temporary differences between financial reporting and income tax basis of assets and liabilities, using current enacted income tax rates and regulations. These differences will result in taxable income or deductions in future years when the reported amount of the asset or liability is recovered or settled, respectively. Considerable judgment is required in determining when these events may occur and whether recovery of an asset, including the utilization of a net operating loss or other carryforward prior to its expiration, is more likely than not. The Company has recorded a deferred tax asset related to historical U-Swirl losses and has determined that these losses are restricted due to a limitation on the deductibility of future losses in accordance with Section 382 of the Internal Revenue Code as a result of the foreclosure transaction. The Company's temporary differences are listed in Note 14.
Gift Card Breakage
The Company and its franchisees sell gift cards that are redeemable for product in stores. The Company manages the gift card program, and therefore collects all funds from the activation of gift cards and reimburses franchisees for the redemption of gift cards in their stores. A liability for unredeemed gift cards is included in current liabilities in our balance sheets.
ROCKY MOUNTAIN CHOCOLATE FACTORY, INC. AND SUBSIDIARIES
NOTES TO CONSOLIDATED FINANCIAL STATEMENTS-(Continued)
There are no expiration dates on the Company’s gift cards, and the Company does not charge any service fees. While the Company’s franchisees continue to honor all gift cards presented for payment, the Company may determine the likelihood of redemption to be remote for certain cards due to long periods of inactivity. The Company recognizes breakage from gift cards when the gift card is redeemed by the customer or the Company determines the likelihood of the gift card being redeemed by the customer is remote (“gift card breakage”). The determination of the gift card breakage rate is based upon Company-specific historical redemption patterns. Accrued gift card liability was $592,932 and $574,883 at February 28, 2023 and February 28, 2022, respectively. The Company recognized breakage of $59,754 and $89,525 during FY 2023 and FY 2022, respectively.
Goodwill
Goodwill arose primarily from two transaction types. The first type was the purchase of various retail stores, either individually or as a group, for which the purchase price was in excess of the fair value of the assets acquired. The second type was from business acquisitions, where the fair value of the consideration given for acquisition exceeded the fair value of the identified assets net of liabilities.
The Company performs a goodwill impairment test on an annual basis or more frequently when events or circumstances indicate that the carrying value of a reporting unit more likely than not exceeds its fair value. The recoverability of goodwill is evaluated through a comparison of the fair value of each of the Company’s reporting units with its carrying value. To the extent that a reporting unit’s carrying value exceeds the implied fair value of its goodwill, an impairment loss is recognized. The Company’s goodwill is further described in Note 7 to the financial statements.
Intangible Assets
Intangible assets represent non-physical assets that create future economic value and are primarily composed of packaging design, store design, trademarks and non-competition agreements. Intangible assets are amortized on a straight line bases over a period ranging from 3 years to 20 years based on the expected future economic value of the intangible asset. Intangible assets are recorded at their cost. The Company performs intangible asset impairment testing on an annual basis or more frequently when events or circumstances indicate that the carrying value of a reporting unit more likely than not exceeds its fair value. The Company’s intangible assets are further described in Note 7 to the financial statements.
Insurance and Self-Insurance Reserves
The Company uses a combination of insurance and self-insurance plans to provide for the potential liabilities for workers’ compensation, general liability, property insurance, director and officers’ liability insurance, vehicle liability and employee health care benefits. Liabilities associated with the risks that are retained by the Company are estimated, in part, by considering historical claims experience, demographic factors, severity factors and other assumptions. While the Company believes that its assumptions are appropriate, the estimated accruals for these liabilities could be significantly affected if future occurrences and claims differ from these assumptions and historical trends.
Sales
The Company has performance obligations to sell products to franchisees and other customers, and revenue is recognized at a point in time. Control is transferred when the order has been shipped to a customer, utilizing a third party, or at the time of delivery when shipped on the Company’s trucks. Revenue is measured based on the amount of consideration that is expected to be received by the Company for providing goods or services under a contract with a customer. Sales of products to franchisees and other customers are made at standard prices, without any bargain sales of equipment or supplies. Sales of products at retail stores are recognized at the time of sale.
Rebates
Rebates received from purveyors that supply products to the Company’s franchisees are included in franchise royalties and fees. Product rebates are recognized in the period in which they are earned. Rebates related to Company-owned locations are offset against operating costs.
Shipping Fees
Shipping fees charged to customers by the Company’s trucking department are reported as sales. Shipping costs incurred by the Company for inventory are reported as cost of sales or inventory.
Franchise and Royalty Fees
The Company recognizes franchise fees over the term of the associated franchise agreement, which is generally a period of 10 years. In addition to the initial franchise fee, the Company also recognizes a marketing and promotion fee of one percent (1%) of franchised stores’ gross retail sales and a royalty fee based on gross retail sales. The Company recognizes no royalty on franchised stores’ retail sales of products purchased from the Company’s manufacturing facility and recognizes a ten percent (10%) royalty on all other sales of product made in store and sold at franchise locations
ROCKY MOUNTAIN CHOCOLATE FACTORY, INC. AND SUBSIDIARIES
NOTES TO CONSOLIDATED FINANCIAL STATEMENTS-(Continued)
Use of Estimates
In preparing consolidated financial statements in conformity with accounting principles generally accepted in the United States of America, management is required to make estimates and assumptions that affect the reported amounts of assets, liabilities, and the disclosure of contingent assets and liabilities, at the date of the consolidated financial statements, and revenues and expenses during the reporting period. Actual results could differ from those estimates.
Stock-Based Compensation
On February 28, 2023, the Company had one stock-based compensation plan, the Company’s 2007 Equity Incentive Plan (as amended and restated), for employees and non-employee directors which authorized the granting of equity awards.
The Company recognized $651,016, $1,073,115, and $511,835 related to equity-based compensation expense during the years ended February 28, 2023, 2022 and 2021, respectively. Compensation costs related to share-based compensation are generally recognized over the vesting period.
During FY 2023, the Company granted 34,200 restricted stock units to non-employee directors with a grant date fair value of $194,940. During FY 2022, the Company granted 26,058 restricted stock units to non-employee directors with a grant date fair value of $221,496. There were no stock options granted to employees during FY 2023 or FY 2022. The restricted stock unit grants generally vest 17% to 20% annually, or 5% per quarter over a period of five to six years. The Company recognized $651,016 of consolidated stock-based compensation expense related to restricted stock unit grants and stock option grants during FY 2023 compared with $1,026,505 in FY 2022 and $511,835 in FY 2021. The total unrecognized stock-based compensation expense of non-vested, non-forfeited shares granted, as of February 28, 2023 was $628,966, which is expected to be recognized over the weighted average period of 1.7 years.
The Company did not issue any unrestricted shares of stock to non-employee directors during the year ended February 28, 2023, compared to 9,000 shares issued during the year ended February 28, 2022 and no shares issued during the year ended February 29, 2021. In connection with these non-employee director stock issuances, the Company recognized $0, $46,610 and $0 of stock-based compensation expense during year ended February 28 or 29, 2023, 2022 and 2021, respectively.
During FY 2023, the Company issued 36,144 stock options and issued up to 94,892 performance-based restricted stock units subject to vesting based on the achievement of performance goals. These issuances were made to the Company’s new Chief Executive Officer and Chief Financial Officer as a part of the incentive compensation structure for Mr. Sarlls and Mr. Arroyo. The stock options were issued with an aggregate grant date fair value of $77,267 or $2.14 per share. The performance-based restricted stock units were issued with an aggregate grant date fair value of $298,582 or $6.29 per share, based upon a target issuance of 47,446 shares. The stock options granted vest with respect to one-third of the shares on the last day of the Company’s current fiscal year ending February 28, 2023, and vest as to remaining shares in equal quarterly increments on the last day of each quarter until the final vesting on February 28, 2025. The performance-based restricted stock units will vest following the end of the Company’s fiscal year ending February 2025 with respect to the target number of performance-based restricted stock units if the Company achieves an annualized total shareholder return of 12.5% during the performance period, subject to continued service through the end of the performance period. The Compensation Committee has the discretion to determine the number of performance-based restricted stock units between 0-200% of the target number that will vest based on the achievement of performance below or above the target performance goal.
During FY 2023 and FY 2022 the Company accelerated 12,499 and 66,667, respectively, of restricted stock units and recognized accelerated expense of $95,156 and $525,000, respectively. These restricted stock units were scheduled to vest through March 2025. The acceleration of the restricted stock units was the result of agreements entered into by the Company and former executives of the Company. See Notes 1, 12 and 19 for additional information on costs associated with the contested solicitation of proxies, change in control severance payments, and the acceleration of restricted stock unit vesting.
Earnings Per Share
Basic earnings per share is computed as net earnings divided by the weighted average number of common shares outstanding during each year. Diluted earnings per share reflects the potential dilution that could occur from common shares issuable through stock options and restricted stock units. Following the expiration of all outstanding options during FY 2017, no stock options were excluded from diluted shares.
The weighted-average number of shares outstanding used in the computation of diluted earnings per share does not include outstanding common shares issuable if their effect would be anti-dilutive. During the year ended February 28, 2023, 960,677 shares of common stock warrants and 137,294 shares of unvested restricted stock units were excluded from the computation of diluted earnings per share because their effect would have been anti-dilutive. During the year ended February 28, 2022, 960,677 shares of common stock warrants and 147,422 shares of unvested restricted stock units were excluded from the computation of diluted earnings per share because their effect would have been anti-dilutive. During the year ended February 28, 2021, 960,677 shares of common stock reserved for issuance under warrants and 217,103 shares of unvested restricted stock units were excluded from the computation of diluted earnings per share because their effect would have been anti-dilutive.
ROCKY MOUNTAIN CHOCOLATE FACTORY, INC. AND SUBSIDIARIES
NOTES TO CONSOLIDATED FINANCIAL STATEMENTS-(Continued)
Advertising and Promotional Expenses
The Company expenses advertising costs as incurred. Total advertising expenses for RMCF amounted to $577,984, $210,103, and $265,285 for the fiscal years ended February 28, 2023, 2022 and 2021, respectively.
Fair Value of Financial Instruments
The Company’s financial instruments consist of cash and cash equivalents, trade receivables, payables, notes payable and notes receivable. The fair value of all instruments approximates the carrying value, because of the relatively short maturity of these instruments. All of the Company’s financial instruments are classified as level 1 and level 2 assets within the fair value hierarchy. The Company does not have any financial instruments classified as level 3 assets.
Recent Accounting Pronouncements
Except for the recent accounting pronouncements described below, other recent accounting pronouncements are not expected to have a material impact on our consolidated financial statements.
In June 2016, the Financial Accounting Standards Board (“FASB”) issued Accounting Standards Update (“ASU”) 2016-13, Financial Instruments - Credit Losses (Topic 326): Measurement of Credit Losses on Financial Instruments. ASU 2016-13 significantly changes the impairment model for most financial assets and certain other instruments. ASU 2016-13 will require immediate recognition of estimated credit losses expected to occur over the remaining life of many financial assets, which will generally result in earlier recognition of allowances for credit losses on loans and other financial instruments and affect the carrying value of accounts receivable. ASU 2016-13 is effective for the Company's fiscal year beginning March 1, 2023, and subsequent interim periods. The Company is currently evaluating the impact the adoption of ASU 2016-13 will have on the Company's consolidated financial statements.
Subsequent Events
Except as described below, management evaluated all activity of the Company through the issue date of the financial statements and concluded that no subsequent events have occurred that would require recognition or disclosure in the financial statements.
On May 1, 2023, subsequent to the end of fiscal year 2023, the Company completed the sale of substantially all of the assets of its wholly-owned subsidiary and frozen yogurt business, U-Swirl International, Inc. (“U-Swirl”). The aggregate sale price of U-Swirl was $2.75 million, consisting of (i) $1.75 million in cash and (ii) $1.0 million evidenced by a three-year secured promissory note. The business divestiture of the U-Swirl segment was preceded by a separate sale of the Company’s three owned U-Swirl locations on February 24, 2023. With the sale of our frozen yogurt segment on May 1, 2023, we continue to focus on our confectionery business to further enhance our competitive position and operating margin, simplify our business model, and deliver sustainable value to our stockholders. The consolidated financial statements present the historical financial results of the former U-Swirl segment as discontinued operations for all periods presented. See Note 20 of the Notes to Consolidated Financial Statements included in Item 8, “Financial Statements and Supplementary Data“, of this Annual Report for information on this divestiture.
On May 8, 2023 the Company announced that Gregory L. Pope, Senior Vice President – Franchise Development, retired effective as of May 3, 2023 (the “Retirement Date”). In connection with his retirement, the Company and Mr. Pope entered into a retirement agreement and general release (the “Retirement Agreement”) that provides (i) Mr. Pope will provide consulting services to the Company, as an independent contractor, until December 31, 2023, for a monthly consulting fee of $22,000, (ii) a retirement bonus of twenty-six equal bi-weekly payments of $12,500 (less tax withholding) payable beginning November 2023, (iii) for accelerated vesting of 8,332 non-vested restricted stock units as of the Retirement Date, (iv) payment of the cost of Mr. Pope’s COBRA premiums for up to 18 months, and (v) reimbursement of Mr. Pope’s legal fees incurred in connection with the Retirement Agreement (not to exceed $7,500). In addition, the Retirement Agreement includes covenants related to cooperation, solicitation and employment, as well as customary release of claims and non-disparagement provisions in favor of the Company, and a non-disparagement provision in favor of Mr. Pope.
NOTE 2 - SUPPLEMENTAL CASH FLOW INFORMATION
For the three years ended February 28:
| Cash paid (received) for: | | 2023 | | | 2022 | | | 2021 | |
| Interest | | $ | 25,000 | | | $ | 5,202 | | | $ | 76,803 | |
| Income taxes | | | (547,763 | ) | | | 240,890 | | | | (21,021 | ) |
ROCKY MOUNTAIN CHOCOLATE FACTORY, INC. AND SUBSIDIARIES
NOTES TO CONSOLIDATED FINANCIAL STATEMENTS-(Continued)
NOTE 3 –REVENUE FROM CONTRACTS WITH CUSTOMERS
The Company recognizes revenue from contracts with its customers in accordance with Accounting Standards Codification® (“ASC”) 606, which provides that revenues are recognized when control of promised goods or services is transferred to a customer in an amount that reflects the consideration expected to be received for those goods or services. The Company generally receives a fee associated with the Franchise Agreement or License Agreement (collectively “Customer Contracts”) at the time that the Customer Contract is entered. These Customer Contracts have a term of up to 20 years, however the majority of Customer Contracts have a term of 10 years. During the term of the Customer Contract, the Company is obligated to many performance obligations that the Company has not determined are distinct. The resulting treatment of revenue from Customer Contracts is that the revenue is recognized proportionately over the life of the Customer Contract.
Initial Franchise Fees, License Fees, Transfer Fees and Renewal Fees
The initial franchise services are not distinct from the continuing rights or services offered during the term of the franchise agreement, and are treated as a single performance obligation. Initial franchise fees are being recognized as the Company satisfies the performance obligation over the term of the franchise agreement, which is generally 10 years.
The following table summarizes contract liabilities as of February 28, 2023 and February 28, 2022:
| | | Twelve Months Ended | |
| | | February 28: | |
| | | 2023 | | | 2022 | |
| Contract liabilities at the beginning of the year: | | $ | 962,572 | | | $ | 958,177 | |
| Revenue recognized | | | (204,657 | ) | | | (179,678 | ) |
| Contract fees received | | | 185,500 | | | | 206,000 | |
| Amortized gain on the financed sale of equipment | | | - | | | | (21,927 | ) |
| Contract liabilities at the end of the year: | | $ | 943,415 | | | $ | 962,572 | |
At February 28, 2023, annual revenue expected to be recognized in the future, related to performance obligations that are not yet fully satisfied, are estimated to be the following:
| 2024 | | $ | 161,137 | |
| 2025 | | | 146,194 | |
| 2026 | | | 133,309 | |
| 2027 | | | 119,878 | |
| 2028 | | | 92,340 | |
| Thereafter | | | 290,557 | |
| Total | | $ | 943,415 | |
Gift Cards
The Company’s franchisees sell gift cards, which do not have expiration dates or non-usage fees. The proceeds from the sale of gift cards by the franchisees are accumulated by the Company and paid out to the franchisees upon customer redemption. ASC 606 requires the use of the “proportionate” method for recognizing breakage. The Company recognizes breakage from gift cards when the gift card is redeemed by the customer or the Company determines the likelihood of the gift card being redeemed by the customer is remote (“gift card breakage”). The determination of the gift card breakage rate is based upon Company-specific historical redemption patterns.
Factory Sales of Confectionary Items, Retail Sales and Royalty and Marketing Fees
Confectionary items sold to the Company’s franchisees, others and its Company-owned stores’ sales are recognized at the time of the underlying sale, based on the terms of the sale and when ownership of the inventory is transferred, and are presented net of sales taxes and discounts. Royalties and marketing fees from franchised or licensed locations, which are based on a percent of sales are recognized at the time the sales occur.
ROCKY MOUNTAIN CHOCOLATE FACTORY, INC. AND SUBSIDIARIES
NOTES TO CONSOLIDATED FINANCIAL STATEMENTS-(Continued)
NOTE 4 – DISAGGREGATION OF REVENUE
The following table presents disaggregated revenue by the method of recognition and segment:
| For the Year Ended February 28, 2023 | | | | | | | | | |
| | | | | | | | | | | | | | | | | |
| Revenues recognized over time: | | | | | |
| | | Franchising | | | Manufacturing | | | Retail | | | Total | |
| Franchise fees | | $ | 204,657 | | | $ | - | | | $ | - | | | $ | 204,657 | |
| Revenues recognized at a point in time: | | | | | |
| | | Franchising | | | Manufacturing | | | Retail | | | Total | |
| Factory sales | | | - | | | | 23,372,133 | | | | - | | | | 23,372,133 | |
| Retail sales | | | - | | | | - | | | | 1,084,777 | | | | 1,084,777 | |
| Royalty and marketing fees | | | 5,770,785 | | | | - | | | | - | | | | 5,770,785 | |
| Total | | $ | 5,975,442 | | | $ | 23,372,133 | | | $ | 1,084,777 | | | $ | 30,432,352 | |
| For the Year Ended February 28, 2022 | | | | | | | | | |
| | | | | | | | | | | | | | | | | |
| Revenues recognized over time: | | | | | |
| | | Franchising | | | Manufacturing | | | Retail | | | Total | |
| Franchise fees | | $ | 179,678 | | | $ | - | | | $ | - | | | $ | 179,678 | |
| Revenues recognized at a point in time: | | | | | |
| | | Franchising | | | Manufacturing | | | Retail | | | Total | |
| Factory sales | | | - | | | | 22,374,175 | | | | - | | | | 22,374,175 | |
| Retail sales | | | - | | | | - | | | | 1,160,295 | | | | 1,160,295 | |
| Royalty and marketing fees | | | 5,774,400 | | | | - | | | | - | | | | 5,774,400 | |
| Total | | $ | 5,954,078 | | | $ | 22,374,175 | | | $ | 1,160,295 | | | $ | 29,488,548 | |
| For the Year Ended February 28, 2021 | | | | | | | | | | | | | |
| | | | | | | | | | | | | | | | | |
| Revenues recognized over time: | | | | | |
| | | Franchising | | | Manufacturing | | | Retail | | | Total | |
| Franchise fees | | $ | 178,042 | | | $ | - | | | $ | - | | | $ | 178,042 | |
| Revenues recognized at a point in time: | | | | | |
| | | Franchising | | | Manufacturing | | | Retail | | | Total | |
| Factory sales | | | - | | | | 17,321,001 | | | | - | | | | 17,321,001 | |
| Retail sales | | | - | | | | - | | | | 896,793 | | | | 896,793 | |
| Royalty and marketing fees | | | 3,367,345 | | | | - | | | | - | | | | 3,367,345 | |
| Total | | $ | 3,545,387 | | | $ | 17,321,001 | | | $ | 896,793 | | | $ | 21,763,181 | |
NOTE 5 - INVENTORIES
Inventories consist of the following at February 28:
| | | 2023 | | | 2022 | |
| Ingredients and supplies | | $ | 2,481,510 | | | $ | 2,753,068 | |
| Finished candy | | | 1,567,887 | | | | 2,168,084 | |
| Reserve for slow moving inventory | | | (409,617 | ) | | | (623,269 | ) |
| Total inventories | | $ | 3,639,780 | | | $ | 4,297,883 | |
ROCKY MOUNTAIN CHOCOLATE FACTORY, INC. AND SUBSIDIARIES
NOTES TO CONSOLIDATED FINANCIAL STATEMENTS-(Continued)
NOTE 6 - PROPERTY AND EQUIPMENT, NET
Property and equipment consists of the following at February 28:
| | | 2023 | | | 2022 | |
| Land | | $ | 513,618 | | | $ | 513,618 | |
| Building | | | 5,151,886 | | | | 5,148,854 | |
| Machinery and equipment | | | 10,152,211 | | | | 9,582,157 | |
| Furniture and fixtures | | | 512,172 | | | | 533,836 | |
| Leasehold improvements | | | 134,010 | | | | 169,683 | |
| Transportation equipment | | | 476,376 | | | | 479,701 | |
| | | | 16,940,273 | | | | 16,427,849 | |
| | | | | | | | | |
| Less accumulated depreciation | | | (11,229,534 | ) | | | (10,976,661 | ) |
| Property and equipment, net | | $ | 5,710,739 | | | $ | 5,451,188 | |
Depreciation expense related to property and equipment totaled $736,358, $710,804, and $751,396 during the fiscal years ended February 28, 2023, 2022 and 2021, respectively.
NOTE 7 – GOODWILL AND INTANGIBLE ASSETS
Goodwill and intangible assets consist of the following at February 28:
| | | | | | | | | 2023 | | | 2022 | |
| | | Amortization Period (in Years) | | | Gross Carrying Value | | | Accumulated Amortization | | | Gross Carrying Value | | | Accumulated Amortization | |
| Intangible assets subject to amortization | | | | | | | | | | | | | | | | | | | | | | |
| Store design | | | | 10 | | | | $ | 394,826 | | | $ | 259,314 | | | $ | 394,826 | | | $ | 240,409 | |
| Packaging licenses | | | 3 | - | 5 | | | | 120,830 | | | | 120,830 | | | | 120,830 | | | | 120,830 | |
| Packaging design | | | | 10 | | | | | 430,973 | | | | 430,973 | | | | 430,973 | | | | 430,973 | |
| Trademark/Non-competition agreements | | | 5 | - | 20 | | | | 259,339 | | | | 128,924 | | | | 259,339 | | | | 118,924 | |
| | | | | | | | | | | | | | | | | | | | | | | |
| Total | | | | | | | | | 1,205,968 | | | | 940,041 | | | | 1,205,968 | | | | 911,136 | |
| Goodwill and intangible assets not subject to amortization | | | | | | | | | | | | | | | | | | | | | | |
| Franchising segment | | | | | | | | | | | | | | | | | | | | | | |
| Company stores goodwill | | | | | | | | $ | 360,972 | | | | | | | $ | 515,065 | | | | | |
| Franchising goodwill | | | | | | | | | 97,318 | | | | | | | | 97,318 | | | | | |
| Manufacturing segment-goodwill | | | | | | | | | 97,318 | | | | | | | | 97,318 | | | | | |
| Trademark | | | | | | | | | 20,000 | | | | | | | | 20,000 | | | | | |
| Total | | | | | | | | | 575,608 | | | | | | | | 729,701 | | | | | |
| | | | | | | | | | | | | | | | | | | | | | | |
| Total Goodwill and Intangible Assets | | | | | | | $ | 1,781,576 | | | $ | 940,041 | | | $ | 1,935,669 | | | $ | 911,136 | |
Changes to goodwill during the fiscal year ended February 28, 2023 consist of the following:
| | | Retail Segment | |
| Balance as of February 28, 2022 | | | | |
| Goodwill | | $ | 515,065 | |
| Impairment losses | | | (84,183 | ) |
| Goodwill written off related to sales of Company-owned stores | | | (69,910 | ) |
| Balance as of February 28, 2023 | | $ | 360,972 | |
Amortization expense related to intangible assets totaled $28,905, $29,371, and $27,051 during the fiscal years ended February 28, 2023, 2022 and 2021, respectively.
At February 28, 2023, annual amortization of intangible assets, based upon the Company’s existing intangible assets and current useful lives, is estimated to be the following:
| 2024 | | | 28,030 | |
| 2025 | | | 27,405 | |
| 2026 | | | 27,405 | |
| 2027 | | | 27,405 | |
| 2028 | | | 27,405 | |
| Thereafter | | | 128,277 | |
| Total | | $ | 265,927 | |
ROCKY MOUNTAIN CHOCOLATE FACTORY, INC. AND SUBSIDIARIES
NOTES TO CONSOLIDATED FINANCIAL STATEMENTS-(Continued)
NOTE 8 – IMPAIRMENT OF LONG-LIVED AND INTANGIBLE ASSETS
We assess the potential impairment of our long-lived assets on an annual basis or whenever events or changes in circumstances indicate the carrying value of the assets or asset group may not be recoverable. During FY 2023 and FY 2021 these tests indicated the impairment of certain long-lived assets. During FY 2021, due to the significant impact of the COVID-19 pandemic on our operations, we recorded $533,000 of expenses associated with the testing of long-lived asset impairment. During FY 2023 we recorded $84,000 of expense associated with the testing of our long-lived assets as a result of the reduction in the number of Company-owned stores in operation and the resulting impairment of goodwill associated with the retail segment. This expense is presented within general and administrative expense on the Consolidated Statements of Operations.
The assessment of our goodwill, trademark and long-lived asset fair values includes many assumptions that are subject to risk and uncertainties. The primary assumptions, which are all Level 3 inputs of the fair value hierarchy (inputs to the valuation methodology that are unobservable and significant to the fair value measurement), used in our impairment testing consist of:
| | ● | Expected future cash flows from the operation of our Company-owned store. |
| | ● | Forecasted future royalty revenue, marketing revenue and associated expenses. |
| | ● | The projected rate of royalty savings on trademarks. |
During FY 2023, 2022, and 2021, costs associated with the impairment of goodwill and long-lived assets consist of the following:
| | | 2023 | | | 2022 | | | 2021 | |
| Company store goodwill impairment | | $ | 84,183 | | | $ | 0 | | | $ | 317,243 | |
| Trademark intangible asset impairment | | | - | | | | - | | | | 159,000 | |
| Company-owned store impairment of long-lived assets | | | - | | | | - | | | | 57,100 | |
| | | | | | | | | | | | | |
| Total | | $ | 84,183 | | | $ | 0 | | | $ | 533,343 | |
NOTE 9 –NOTES PAYABLE AND REVOLVING CREDIT LINE
Paycheck Protection Program
During FY 2021 the Company received promissory notes pursuant to the Paycheck Protection Program (“PPP”), under the recently enacted Coronavirus Aid, Relief, and Economic Security Act (“CARES Act”) administered by the U.S. Small Business Administration (the “SBA Loans”). The Company received total proceeds of $1.4 million from SBA Loans. During FY 2021, approximately $1.4 million, representing all of the original loan proceeds, was forgiven by the SBA.
The amount of loan proceeds eligible for forgiveness was based on a formula based on a number of factors, including the amount of loan proceeds used by the Company during the period after the loan origination for certain purposes, including payroll costs, interest on certain mortgage obligations, rent payments on certain leases, and certain qualified utility payments, provided that, among other things, at least 60-75% of the loan amount is used for eligible payroll costs, the employer maintaining or rehiring employees and maintaining salaries at a certain level. In accordance with the requirements of the CARES Act and the PPP, the Company believes it has used the proceeds from the SBA Loans for qualifying expenses.
Revolving Credit Line
The Company has a $5.0 million credit line for general corporate and working capital purposes, of which $5.0 million was available for borrowing (subject to certain borrowing base limitations) as of February 28, 2023. The credit line is secured by substantially all of the Company’s assets, except retail store assets. Interest on borrowings is at SOFR plus 2.37% (6.92% at February 28, 2023). Additionally, the line of credit is subject to various financial ratio and leverage covenants. At February 28, 2023, the Company was in compliance with all such covenants. The credit line is subject to renewal in September 2023.
NOTE 10 - STOCK COMPENSATION PLANS
In FY 2021, stockholders approved an amendment and restatement of the 2007 Equity Incentive Plan (as amended and restated, the “2007 Plan”). The 2007 Plan allows awards of stock options, stock appreciation rights, stock awards, restricted stock and stock units, performance shares and performance units, and other stock- or cash-based awards.
ROCKY MOUNTAIN CHOCOLATE FACTORY, INC. AND SUBSIDIARIES
NOTES TO CONSOLIDATED FINANCIAL STATEMENTS-(Continued)
The following table summarizes stock awards under the 2007 Plan as of February 28, 2023:
| Original share authorization: | | | 300,000 | |
| Prior plan shares authorized and incorporated in the 2007 Plan: | | | 85,340 | |
| Additional shares authorized through 2007 Plan amendments: | | | 600,000 | |
| Available for award: | | | 985,340 | |
| Cancelled/forfeited: | | | 244,647 | |
| Shares awarded as unrestricted shares, stock options or restricted stock units: | | | (1,066,781 | ) |
| | | | | |
| Shares available for award: | | | 163,206 | |
Information with respect to restricted stock unit awards outstanding under the 2007 Plan at February 28, 2023, and changes for the three years then ended was as follows:
| | | Twelve Months Ended | |
| | | February 28: | |
| | | 2023 | | | 2022 | | | 2021 | |
| Outstanding non-vested restricted stock units at beginning of year: | | | 105,978 | | | | 209,450 | | | | 265,555 | |
| Granted | | | 129,092 | | | | 26,058 | | | | - | |
| Vested | | | (70,782 | ) | | | (127,130 | ) | | | (54,761 | ) |
| Cancelled/forfeited | | | (10,157 | ) | | | (2,400 | ) | | | (1,344 | ) |
| Outstanding non-vested restricted stock units as of February 28: | | | 154,131 | | | | 105,978 | | | | 209,450 | |
| | | | | | | | | | | | | |
| Weighted average grant date fair value | | $ | 5.23 | | | $ | 9.33 | | | $ | 9.40 | |
| Weighted average remaining vesting period (in years) | | | 1.73 | | | | 2.26 | | | | 3.68 | |
Information with respect to stock option awards outstanding under the 2007 Plan at February 28, 2023, and changes for the three years then ended was as follows:
| | | Twelve Months Ended | |
| | | February 28: | |
| | | 2023 | | | 2022 | | | 2021 | |
| Outstanding stock options at beginning of year: | | | - | | | | - | | | | - | |
| Granted | | | 36,144 | | | | - | | | | - | |
| Exercised | | | - | | | | - | | | | - | |
| Cancelled/forfeited | | | - | | | | - | | | | - | |
| Outstanding stock options as of February 28 or 29: | | | 36,144 | | | | - | | | | - | |
| | | | | | | | | | | | | |
| Weighted average exercise price | | | 6.49 | | | | n/a | | | | n/a | |
| Weighted average remaining contractual term (in years) | | | 9.26 | | | | n/a | | | | n/a | |
NOTE 11 – LEASING ARRANGEMENTS
The Company conducts its retail operations in facilities leased under non-cancelable operating leases of up to ten years. Certain leases contain renewal options for between five and ten additional years at increased monthly rentals. Some of the leases provide for contingent rentals based on sales in excess of predetermined base levels.
The Company acts as primary lessee of some franchised store premises, which the Company then subleases to franchisees, but the majority of existing franchised locations are leased by the franchisee directly.
In some instances, the Company has leased space for its Company-owned locations that are now occupied by franchisees. When the Company-owned location was sold or transferred, the store was subleased to the franchisee who is responsible for the monthly rent and other obligations under the lease.
The following is a schedule of lease expense for all retail operating leases for the three years ended February 28:
| | | 2023 | | | 2022 | | | 2021 | |
| Minimum rentals | | $ | 106,203 | | | $ | 136,125 | | | $ | 189,696 | |
| Less sublease rentals | | | (39,186 | ) | | | (60,254 | ) | | | (113,515 | ) |
| Contingent rentals | | | 30,600 | | | | 22,800 | | | | 10,800 | |
| | | $ | 97,617 | | | $ | 98,671 | | | $ | 86,981 | |
ROCKY MOUNTAIN CHOCOLATE FACTORY, INC. AND SUBSIDIARIES
NOTES TO CONSOLIDATED FINANCIAL STATEMENTS-(Continued)
The Company also leases trucking equipment and warehouse space in support of its manufacturing operations. Expense associated with trucking and warehouse leases is included in cost of sales on the consolidated statements of operations.
The following is a schedule of lease expense for trucking equipment operating leases for the three years ended February 28:
| 2023 | | | 2022 | | | 2021 | |
| 351,738 | | | | 270,767 | | | | 340,731 | |
As of February 28, 2023 and 2022 the Company was party to nine leasing arrangements for its retail operations, manufacturing facility, franchisees subleases, and trucking equipment as described above.
ASU 2016-02 Leases (Topic 842) allows, as a practical expedient, the retention of the classification of existing leases as operating or financing. All of the Company’s leases are classified as operating leases and that classification has been retained upon adoption. The Company does not believe the utilization of this practical expedient has a material impact on lease classifications.
The amount of the ‘Right of Use Asset’ and ‘Lease Liability’ recorded in the Consolidated Balance Sheets upon the adoption of ASU 2016-02 was $3.3 million. The lease liability reflects the present value of the Company’s estimated future minimum lease payments over the life of its leases. This includes known escalations and renewal option periods reasonably assured of being exercised. Typically, renewal options are considered reasonably assured of being exercised if the sales performance of the location remains strong. Therefore, the ‘Right of Use Asset’ and ‘Lease Liability’ include an assumption on renewal options that have not yet been exercised by the Company, and are not currently a future obligation. The Company has separated non-lease components from lease components in the recognition of the ‘Right of Use Asset’ and ‘Lease Liability’ except in instances where such costs were not practical to separate. To the extent that occupancy costs, such as site maintenance, are included in the ‘Right of Use Asset’ and ‘Lease Liability,’ the impact is immaterial. For franchised locations, the related occupancy costs including property taxes, insurance and site maintenance are generally required to be paid by the franchisees as part of the franchise arrangement. In addition, the Company is the lessee under non-store related leases such as storage facilities and trucking equipment. For leases where the implicit rate is not readily determinable, the Company uses an incremental borrowing rate to calculate the lease liability that represents an estimate of the interest rate the Company would incur to borrow on a collateralized basis over the term of a lease. The weighted average discount rate used for operating leases was 3.4%, 3.1%, and 3.4% as of February 28, 2023, 2022 and 2021, respectively. The total estimated future minimum lease payments is $2.6 million.
As of February 28, 2023, maturities of lease liabilities for the Company’s operating leases were as follows:
| FYE 24 | | $ | 760,952 | |
| FYE 25 | | | 611,988 | |
| FYE 26 | | | 514,346 | |
| FYE 27 | | | 242,558 | |
| FYE 28 | | | 71,671 | |
| Thereafter | | | 390,450 | |
| Total | | $ | 2,591,965 | |
| | | | | |
| Less: Imputed interest | | | (205,442 | ) |
| Present value of lease liabilities: | | $ | 2,386,523 | |
The weighted average lease term at February 28, 2023, 2022, and 2021 was 5.5 years, 6.7 years and 6.9 years, respectively.
The following is a schedule of cash paid for lease liabilities for the three years ended February 28:
| | | 2023 | | | 2022 | | | 2021 | |
| Cash paid for amounts included in the measurement of lease liabilities | | | 572,079 | | | | 563,264 | | | | 530,137 | |
During the years ended February 28, 2023, 2022, and 2021 the Company entered into new leases representing a future lease liability of $1,472,667, $588,475, and $0, respectively.
The Company did not have any leases categorized as finance leases as of February 28, 2023 or February 28, 2022.
ROCKY MOUNTAIN CHOCOLATE FACTORY, INC. AND SUBSIDIARIES
NOTES TO CONSOLIDATED FINANCIAL STATEMENTS-(Continued)
NOTE 12 – COMMITMENTS AND CONTINGENCIES
Employment Agreement Payments upon a Change in Control
We have entered into employment agreements with certain of our former executives which contain, among other things, "change in control" severance provisions.
The employment agreement of Mr. Dudley generally provides that, if the Company or the executive terminates the executive's employment under circumstances constituting a "triggering termination," the executive will be entitled to receive, among other benefits, 2.99 times the sum of (i) the executive's annual salary using the highest annual base compensation rate in effect at any time during employment and (ii) the greater of (a) two times the bonus that would be payable to the executive for the bonus period in which the change in control occurred or (b) 25% of the amount described in clause (i). The employment agreement of Mr. Dudley also provided for a payment of $18,000, which represents the estimated cost to the executive of obtaining accident, health, dental, disability, and life insurance coverage for the 18-month period following the expiration of COBRA coverage.
A “change in control,” as used in the agreement for Mr. Dudley, generally means a change in the control of the Company following any number of events, but specifically, a proxy contest in which our Board of Directors prior to the transaction constitutes less than a majority of our Board of Directors after the transaction or the members of our Board of Directors during any consecutive two-year period who at the beginning of such period constituted the Board of Directors cease to be the majority of the Board of Directors at the conclusion of that period. We have determined that a change in control has taken place on October 6, 2021. A “triggering termination” generally occurs when an executive is terminated during a specified period preceding a change in control of us, or if the executive or the Company terminates the executive’s employment under circumstances constituting a triggering termination during a specified period after a change in control. A triggering termination may also include a voluntary termination under certain scenarios.
In connection with Mr. Dudley’s retirement, Mr. Dudley and the Company entered into a Separation Agreement and General Release (the “Separation Agreement”), dated September 30, 2022 (the “Effective Date”). Under the Separation Agreement, Mr. Dudley retired from the Company on the Effective Date and will be entitled, subject to the terms and conditions therein, to the following payments and separation benefits: (i) a cash separation payment amount in accordance with Mr. Dudley’s employment agreement; (ii) acceleration of vesting of Mr. Dudley’s 12,499 unvested restricted stock units as of the Effective Date; (iii) an additional cash severance payment of $70,000; and (iv) Mr. Dudley has agreed to provide consulting services to the Company through December 31, 2022, to the extent requested by the Company, for which he will receive a cash payment of $56,250. In addition, the Separation Agreement includes covenants related to cooperation, solicitation, and employment, as well as the customary release of claims and non-disparagement provisions in favor of the Company.
Mr. Sarlls’ employment agreement provides for the following upon “change in control”: If Mr. Sarlls’ employment is involuntarily terminated without cause or if he resigns for good reason on or within 2 years following consummation of a change in control, the cash severance amount (15 months of base salary) which would otherwise be payable on the regular payroll schedule over a 15-month period following separation (if severance were due outside the change in control context) will be accelerated and paid in a lump sum promptly following separation. Mr. Sarlls’ agreement incorporates by reference the change in control definition set forth in Treasury Regulation Section 1.409A-3(i)(5).
Mr. Arroyo’s employment agreement provides for the following upon “change in control”: If Mr. Arroyo’s employment is involuntarily terminated without cause or if he resigns for good reason on or within 2 years following consummation of a change in control, the cash severance amount (9 months of base salary) which would otherwise be payable on the regular payroll schedule over a 9-month period following separation (if severance were due outside the change in control context) will be accelerated and paid in a lump sum promptly following separation. Mr. Arroyo’s agreement incorporates by reference the change in control definition set forth in Treasury Regulation Section 1.409A-3(i)(5).
ROCKY MOUNTAIN CHOCOLATE FACTORY, INC. AND SUBSIDIARIES
NOTES TO CONSOLIDATED FINANCIAL STATEMENTS-(Continued)
Purchase contracts
The Company frequently enters into purchase contracts of between six to eighteen months for chocolate and certain nuts. These contracts permit the Company to purchase the specified commodity at a fixed price on an as-needed basis during the term of the contract. Because prices for these products may fluctuate, the Company may benefit if prices rise during the terms of these contracts, but it may be required to pay above-market prices if prices fall and it is unable to renegotiate the terms of the contract. As of February 28, 2023, the Company was contracted for approximately $384,000 of raw materials under such agreements. The Company has designated these contracts as normal under the normal purchase and sale exception under the accounting standards for derivatives. These contracts are not entered into for speculative purposes.
Litigation
From time to time, the Company is involved in litigation relating to claims arising out of its operations. The Company records accruals for outstanding legal matters when it believes it is probable that a loss will be incurred and the amount can be reasonably estimated. At February 28, 2023, the Company was not a party to any legal proceedings that were expected, individually or in the aggregate, to have a material adverse effect on our business, financial condition or operating results.
NOTE 13 – STOCKHOLDERS’ EQUITY
Redemption of Preferred Stock Purchase Rights
On October 2, 2021, the Board of Directors approved the redemption of all the outstanding preferred stock purchase rights (the “Rights”) granted pursuant to the Rights Agreement, dated March 1, 2015, between the Company and Computershare Trust Company, N.A., as Rights Agent (as amended, the “Rights Agreement”), commonly referred to as a “poison pill.” Immediately upon the action of the Board of Directors to approve the redemption of the Rights, the right to exercise the Rights terminated, which effectively terminated the Rights Agreement. Pursuant to the Rights Agreement, the Rights were redeemed at a redemption price of $0.01 per Right. As a result, the Company paid an aggregate amount of $61,276 to stockholders in October 2021 to redeem the Rights.
Warrants
In consideration of Edible entering into the exclusive supplier agreement and the performance of its obligations therein, on December 20, 2019, the Company issued Edible a warrant (the “Warrant”) to purchase up to 960,677 shares of the Company’s common stock (the “Warrant Shares”) at an exercise price of $8.76 per share. The Warrant Shares vest in annual tranches in varying amounts following each contract year under the exclusive supplier agreement, subject to, and only upon, Edible’s achievement of certain revenue thresholds on an annual or cumulative five-year basis in connection with its performance under the exclusive supplier agreement. The Warrant expires six months after the final and conclusive determination of revenue thresholds for the fifth contract year and the cumulative revenue determination in accordance with the terms of the Warrant. As of February 28, 2023, no warrants have vested and subsequent to the termination by the Company of the Exclusive Supplier Agreement on November 1, 2022, the Company has no remaining material obligations under the Warrant.
The Company determined that the grant date fair value of the warrants was de minimis and did not record any amount in consideration of the warrants. The Company utilized a Monte Carlo model for purposes of determining the grant date fair value.
NOTE 14 - INCOME TAXES
Income tax expense (benefit) is comprised of the following for the years ended February 28:
| | | 2023 | | | 2022 | | | 2021 | |
| Current | | | | | | | | | | | | |
| Federal | | $ | (116,792 | ) | | $ | 204,058 | | | $ | (294,368 | ) |
| State | | | 8,472 | | | | 46,704 | | | | 44,643 | |
| Total Current | | | (108,320 | ) | | | 250,762 | | | | (249,725 | ) |
| | | | | | | | | | | | | |
| Deferred | | | | | | | | | | | | |
| Federal | | | 621,841 | | | | (231,430 | ) | | | (425,580 | ) |
| State | | | 100,322 | | | | (36,144 | ) | | | (70,190 | ) |
| Total Deferred | | | 722,163 | | | | (267,574 | ) | | | (495,770 | ) |
| Total | | $ | 613,843 | | | $ | (16,812 | ) | | $ | (745,495 | ) |
ROCKY MOUNTAIN CHOCOLATE FACTORY, INC. AND SUBSIDIARIES
NOTES TO CONSOLIDATED FINANCIAL STATEMENTS-(Continued)
A reconciliation of the statutory federal income tax rate and the effective rate as a percentage of pretax income is as follows for the years ended February 28:
| | | 2023 | | | 2022 | | | 2021 | |
| Statutory rate | | | 21.0 | % | | | 21.0 | % | | | 21.0 | % |
| State income taxes, net of federal benefit | | | 2.9 | % | | | 3.8 | % | | | 4.3 | % |
| Paycheck Protection Program debt forgiveness | | | 0.0 | % | | | 0.0 | % | | | 28.7 | % |
| Work opportunity tax credits | | | 0.0 | % | | | (1.2 | )% | | | 0.3 | % |
| Equity compensation tax expense | | | (0.7 | )% | | | (8.2 | )% | | | (2.5 | )% |
| Compensation and benefits permanent differences | | | (3.2 | )% | | | (1.9 | )% | | | 0.0 | % |
| Other | | | 0.7 | % | | | 0.1 | % | | | 0.6 | % |
| Valuation allowance | | | (33.3 | )% | | | 0.0 | % | | | 0.0 | % |
| Impact of CARES act | | | 0.0 | % | | | (10.3 | )% | | | 12.1 | % |
| Effective tax rate | | | (12.6 | )% | | | 3.3 | % | | | 64.5 | % |
During FY 2023 the Company’s effective tax rate resulted in recognition of income tax expense despite incurring a pretax loss. During FY 2023 income tax expense was primarily the result of expense associated with an increase in reserves for deferred tax assets. Management evaluated recent losses before income taxes and determined that it is no longer more likely than not that our deferred income taxes are fully realizable. Because of this determination, the Company reserved for approximately $1.6 million of deferred tax assets. As of February 28, 2023, the Company has a full valuation allowance against its deferred tax assets.
During FY 2022 the low effective income tax rate was primarily the result of permanent differences between the Company’s expenses as valued for financial reporting purposes versus for income tax purposes. These differences were primarily valuation of restricted stock units and the period of recognition for employee retention credits. During FY 2021 the Company’s effective tax rate resulted in recognition of an income tax benefit as a result of a pretax loss being recognized for the year.
The effective income tax rate for the year ended February 28, 2021 was a result of debt forgiveness income being realized with no associated income tax expense and the revaluation of a portion of deferred tax assets as a result of the Company realizing a taxable loss during FY 2021 that can be carried back to prior periods with a higher effective income tax rate.
The components of deferred income taxes at February 28 are as follows:
| | | 2023 | | | 2022 | |
| Deferred Tax Assets | | | | | | | | |
| Allowance for doubtful accounts and notes | | $ | 182,031 | | | $ | 225,515 | |
| Inventories | | | 100,725 | | | | 153,262 | |
| Accrued compensation | | | 158,652 | | | | 429,076 | |
| Loss provisions and deferred income | | | 340,652 | | | | 379,069 | |
| Self-insurance accrual | | | 24,098 | | | | 27,049 | |
| Amortization | | | - | | | | - | |
| Restructuring charges | | | 98,693 | | | | 98,693 | |
| Accumulated net losses | | | 1,669,288 | | | | 445,560 | |
| Valuation allowance | | | (1,721,306 | ) | | | (98,693 | ) |
| Net deferred tax assets | | $ | 852,833 | | | $ | 1,659,531 | |
| | | | | | | | | |
| Deferred Tax Liabilities | | | | | | | | |
| Depreciation and amortization | | | (771,593 | ) | | | (860,318 | ) |
| Prepaid expenses | | | (81,240 | ) | | | (77,050 | ) |
| Deferred Tax Liabilities | | | (852,833 | ) | | | (937,368 | ) |
| | | | | | | | | |
| Net deferred tax assets | | $ | - | | | $ | 722,163 | |
The following table summarizes deferred income tax valuation allowances as of February 28:
| | | 2023 | | | 2022 | |
| Valuation allowance at beginning of period | | $ | 98,693 | | | $ | 98,693 | |
| Tax expense realized by valuation allowance | | | 1,622,613 | | | | - | |
| Valuation allowance at end of period | | $ | 1,721,306 | | | $ | 98,693 | |
ROCKY MOUNTAIN CHOCOLATE FACTORY, INC. AND SUBSIDIARIES
NOTES TO CONSOLIDATED FINANCIAL STATEMENTS-(Continued)
Under the recently enacted CARES Act a net operating loss (“NOL”) arising during the Company’s fiscal year 2021 can be carried back for five years to offset the Company’s taxable income for fiscal years 2016-2020. This five-year period spans Federal effective tax rates for the Company ranging from 21% to 34%, the result of the Tax Cuts and Jobs Act enacted during the Company’s fiscal year ended February 28, 2018. During FY 2022 the Company filed returns necessary to carry back FY 2021 losses to offset the Company’s taxable income in prior years. As a result, approximately $317,000 was included in refundable income taxes at February 28, 2022.
The Company’s deferred tax assets are valued at the current federally enacted rate of 21%. The loss carryback provisions of the CARES Act will enable the Company to offset taxable income from prior years when federally enacted tax rates were higher than 21%. As a result, the Company incurred a gain associated with the revaluation of the Company’s deferred tax assets in the amount of $148,000 during FY 2021.
In December 2020 the Consolidated Appropriations Act, 2021 (bill) inclusive of additional coronavirus aid was signed into law. Among the many provisions of the bill, expenses related to the receipt of paychecks protection program funds (“PPP”) that were previously determined to be non-deductible by the Internal Revenue Service (“IRS”) may now be deducted for federal income tax purposes. As a result, the Company realized debt forgiveness income of $1.4 million during FY 2021 with no associated income taxes.
The Company files income tax returns in the U.S. federal and various state taxing jurisdictions. With few exceptions, the Company is no longer subject to U.S. federal and state tax examinations in its major tax jurisdictions for periods before FY 2018.
Realization of the Company's deferred tax assets is dependent upon the Company generating sufficient taxable income, in the appropriate tax jurisdictions, in future years, to obtain benefit from the reversal of net deductible temporary differences. The amount of deferred tax assets considered realizable is subject to adjustment in future periods if estimates of future taxable income are changed. A valuation allowance to reduce the carrying amount of deferred income tax assets is established when it is more likely than not that we will not realize some portion or all of the tax benefit of our deferred income tax assets. We evaluate, on a quarterly basis, whether it is more likely than not that our deferred income tax assets are realizable based upon recent past financial performance, tax reporting positions, and expectations of future taxable income. The determination of deferred tax assets is subject to estimates and assumptions. We periodically evaluate our deferred tax assets to determine if our assumptions and estimates should change.
During FY 2023, FY 2022, and FY 2021, the Company incurred significant losses before income taxes, primarily as a result of substantial costs associated with a stockholder’s contested solicitation of proxies in connection with our 2022 and 2021 annual meetings of stockholders. Management evaluated recent losses before income taxes and determined that it is no longer more likely than not that our deferred income taxes are fully realizable. Because of this determination, the Company reserved for approximately $1.6 million of deferred tax assets. As of February 28, 2023, the Company has a full valuation allowance against its deferred tax assets.
The Company accounts for uncertainty in income taxes by recognizing the tax benefit from an uncertain tax position only if it is more likely than not that the tax position will be sustained on examination by the taxing authorities, based on the technical merits of the position. The Company measures the tax benefits recognized in the consolidated financial statements from such a position based on the largest benefit that has a greater than 50% likelihood of being realized upon ultimate resolution. The application of income tax law is inherently complex. As such, the Company is required to make judgments regarding income tax exposures. Interpretations of and guidance surrounding income tax law and regulations change over time and may result in changes to the Company's judgments which can materially affect amounts recognized in the balance sheets and statements of operations. The result of the assessment of the Company's tax positions did not have an impact on the consolidated financial statements for the years ended February 28, 2023 or 2022. The Company does not have any significant unrecognized tax benefits and does not anticipate a significant increase or decrease in unrecognized tax benefits within the next twelve months. Amounts are recognized for income tax related interest and penalties as a component of general and administrative expense in the statement of income and are immaterial for years ended February 28, 2023 and 2022.
The Company’s subsidiaries, SWRL, along with U-Swirl had a history of net operating losses prior to the company’s acquisition of them and thus the Company has a related net operating loss carry forward. In accordance with Section 382 of the Internal Revenue Code, deductibility of SWRL’s and U-Swirl’s Federal net operating loss carryovers may be subject to annual limitation in the event of a change in control. The Company has performed a preliminary evaluation as to whether a change in control has taken place, and has concluded that there was a change of control with respect to the net operating losses of U-Swirl when the Company acquired its controlling ownership interest. The initial limitations will continue to limit deductibility of SWRL’s and U-Swirl’s net operating loss carryovers, but the annual loss limitation will be deductible to RMCF and U-Swirl International Inc. upon the filing of joint tax returns in FY 2017 and future years.
The Company estimates that the potential future tax deductions of U-Swirl’s Federal net operating losses, limited by section 382, to be approximately $1,811,000 with a resulting deferred tax asset of approximately $445,000. U-Swirl’s Federal net operating loss carryovers will expire at various dates beginning in 2026.
ROCKY MOUNTAIN CHOCOLATE FACTORY, INC. AND SUBSIDIARIES
NOTES TO CONSOLIDATED FINANCIAL STATEMENTS-(Continued)
Income tax provision (benefit) allocated to continuing operations and discontinued operations for the years ended February 28, 2023, 2022 and 2021 was as follows:
| | | 2023 | | | 2022 | | | 2021 | |
| Continuing operations | | $ | 613,843 | | | $ | (16,812 | ) | | $ | (745,495 | ) |
| Discontinued operations | | | 618,308 | | | | 52,194 | | | | (146,419 | ) |
| Total tax provision (benefit) | | $ | 1,232,151 | | | $ | 35,382 | | | $ | (891,914 | ) |
NOTE 15 - EMPLOYEE BENEFIT PLAN
The Company has a 401(k) plan called the Rocky Mountain Chocolate Factory, Inc. 401(k) Plan. Eligible participants are permitted to make contributions up to statutory limits. The Company makes a matching contribution, which vests ratably over a 3-year period, and is 25% of the employee’s contribution up to a maximum of 1.5% of the employee’s compensation. During the years ended February 28, 2023, 2022 and 2021, the Company’s contribution was approximately $68,000, $67,000, and $62,000, respectively, to the plan.
NOTE 16 - OPERATING SEGMENTS
The Company classifies its business interests into four reportable segments: Rocky Mountain Chocolate Factory, Inc. Franchising, Manufacturing, Retail Stores, and Other, which is the basis upon which the Company’s chief operating decision maker evaluates the Company’s performance. The accounting policies of the segments are the same as those described in the summary of significant accounting policies in Note 1 to these consolidated financial statements. The Company evaluates performance and allocates resources based on operating contribution, which excludes unallocated corporate general and administrative costs and income tax expense or benefit. The Company’s reportable segments are strategic businesses that utilize common merchandising, distribution, and marketing functions, as well as common information systems and corporate administration. All inter-segment sales prices are market based. Each segment is managed separately because of the differences in required infrastructure and the differences in products and services:
| FY 2023 | | Franchising | | | Manufacturing | | | Retail | | | Other | | | Total | |
| Total revenues | | $ | 5,980,945 | | | $ | 24,628,317 | | | $ | 1,084,777 | | | $ | - | | | $ | 31,694,039 | |
| Intersegment revenues | | | (5,503 | ) | | | (1,256,184 | ) | | | - | | | | - | | | | (1,261,687 | ) |
| Revenue from external customers | | | 5,975,442 | | | | 23,372,133 | | | | 1,084,777 | | | | - | | | | 30,432,352 | |
| Segment profit (loss) | | | 2,601,485 | | | | 2,832,307 | | | | 130,880 | | | | (10,439,185 | ) | | | (4,874,513 | ) |
| Total assets | | | 1,245,331 | | | | 9,792,491 | | | | 442,977 | | | | 10,506,028 | | | | 21,986,827 | |
| Capital expenditures | | | 17,129 | | | | 899,219 | | | | 5,413 | | | | 78,254 | | | | 1,000,015 | |
| Total depreciation & amortization | | $ | 34,301 | | | $ | 652,405 | | | $ | 5,845 | | | $ | 72,712 | | | $ | 765,263 | |
| FY 2022 | | Franchising | | | Manufacturing | | | Retail | | | Other | | | Total | |
| Total revenues | | $ | 5,959,624 | | | $ | 23,442,371 | | | $ | 1,160,295 | | | $ | - | | | $ | 30,562,290 | |
| Intersegment revenues | | | (5,546 | ) | | | (1,068,196 | ) | | | - | | | | - | | | | (1,073,742 | ) |
| Revenue from external customers | | | 5,954,078 | | | | 22,374,175 | | | | 1,160,295 | | | | - | | | | 29,488,548 | |
| Segment profit (loss) | | | 2,862,263 | | | | 3,863,460 | | | | 75,962 | | | | (7,318,214 | ) | | | (516,529 | ) |
| Total assets | | | 1,160,343 | | | | 10,023,716 | | | | 625,850 | | | | 15,070,852 | | | | 26,880,761 | |
| Capital expenditures | | | 1,832 | | | | 797,178 | | | | 3,688 | | | | 138,629 | | | | 941,327 | |
| Total depreciation & amortization | | $ | 36,625 | | | $ | 627,071 | | | $ | 5,635 | | | $ | 70,844 | | | $ | 740,175 | |
| FY 2021 | | Franchising | | | Manufacturing | | | Retail | | | Other | | | Total | |
| Total revenues | | $ | 3,549,055 | | | $ | 18,316,165 | | | $ | 896,793 | | | $ | - | | | $ | 22,762,013 | |
| Intersegment revenues | | | (3,668 | ) | | | (995,164 | ) | | | - | | | | - | | | | (998,832 | ) |
| Revenue from external customers | | | 3,545,387 | | | | 17,321,001 | | | | 896,793 | | | | - | | | | 21,763,181 | |
| Segment profit (loss) | | | 846,039 | | | | 1,422,491 | | | | (309,799 | ) | | | (3,113,948 | ) | | | (1,155,217 | ) |
| Total assets | | | 1,338,990 | | | | 9,330,194 | | | | 634,124 | | | | 13,647,844 | | | | 24,951,152 | |
| Capital expenditures | | | 150 | | | | 103,003 | | | | 4,505 | | | | 41,859 | | | | 149,517 | |
| Total depreciation & amortization | | $ | 42,579 | | | $ | 642,806 | | | $ | 14,150 | | | $ | 78,912 | | | $ | 778,447 | |
ROCKY MOUNTAIN CHOCOLATE FACTORY, INC. AND SUBSIDIARIES
NOTES TO CONSOLIDATED FINANCIAL STATEMENTS-(Continued)
NOTE 17 – SUMMARIZED QUARTERLY DATA (UNAUDITED)
Following is a summary of the quarterly results of operations for the fiscal years ended February 28, 2023 and 2022:
| | | Fiscal Quarter | | | | | | | | | | |
| 2023 | | First | | | Second | | | Third | | | Fourth | | | Total | |
| Total revenue | | $ | 6,902,198 | | | $ | 6,557,356 | | | $ | 8,825,093 | | | $ | 8,147,705 | | | $ | 30,432,352 | |
| Gross margin | | | 881,699 | | | | 1,181,806 | | | | 1,859,186 | | | | 78,846 | | | | 4,001,537 | |
| Net (loss) income from continuing operations | | | (285,767 | ) | | | (3,152,491 | ) | | | (196,157 | ) | | | (1,853,941 | ) | | | (5,488,356 | ) |
| Net (loss) income from discontinued operations | | | 170,826 | | | | (488,695) | | | | (15,822 | ) | | | 141,269 | | | | (192,422 | ) |
| Net (loss) income | | $ | (114,941 | ) | | $ | (3,641,186 | ) | | $ | (211,979 | ) | | $ | (1,712,672 | ) | | $ | (5,680,778 | ) |
| Basic earnings (loss) per share | | | | | | | | | | | | | | | | | | | | |
| Earnings (loss) from continuing operations | | $ | (0.05 | ) | | $ | (0.51 | ) | | $ | (0.03 | ) | | $ | (0.29 | ) | | $ | (0.88 | ) |
| Earnings (loss) from discontinued operations | | | 0.03 | | | | (.08 | ) | | | - | | | | 0.02 | | | | (.03 | ) |
| Net Earnings | | $ | (0.02 | ) | | $ | (0.59 | ) | | $ | (0.03 | ) | | $ | (0.27 | ) | | $ | (0.91 | ) |
| Diluted earnings (loss) per share | | | | | | | | | | | | | | | | | | | | |
| Earnings (loss) from continuing operations | | $ | (0.05 | ) | | $ | (0.51 | ) | | $ | (0.03 | ) | | $ | (0.29 | ) | | $ | (0.88 | ) |
| Earnings (loss) from discontinued operations | | | 0.03 | | | | (.08 | ) | | | - | | | | 0.02 | | | | (.03 | ) |
| Net Earnings | | $ | (0.02 | ) | | $ | (0.59 | ) | | $ | (0.03 | ) | | $ | (0.27 | ) | | $ | (0.91 | ) |
| | | Fiscal Quarter | | | | | | | | | | |
| 2022 | | First | | | Second | | | Third | | | Fourth | | | Total | |
| Total revenue | | $ | 6,757,428 | | | $ | 7,033,474 | | | $ | 7,902,033 | | | $ | 7,795,613 | | | $ | 29,488,548 | |
| Gross margin | | | 925,141 | | | | 1,519,680 | | | | 1,580,543 | | | | 898,367 | | | | 4,923,731 | |
| Net (loss) income from continuing operations | | | 447,820 | | | | 84,272 | | | | (1,413,010 | ) | | | 381,201 | | | | (499,717 | ) |
| Net (loss) income from discontinued operations | | | 131,985 | | | | 112661 | | | | (64,636 | ) | | | (21,990 | ) | | | 158,020 | |
| Net (loss) income | | $ | 579,805 | | | $ | 196,933 | | | $ | (1,477,646 | ) | | $ | 359,211 | | | $ | (341,697 | ) |
| Basic earnings (loss) per share | | | | | | | | | | | | | | | | | | | | |
| Earnings (loss) from continuing operations | | $ | 0.07 | | | $ | 0.01 | | | $ | (0.23 | ) | | $ | 0.06 | | | $ | (0.08 | ) |
| Earnings (loss) from discontinued operations | | | 0.02 | | | | 0.02 | | | | (0.01 | ) | | | - | | | | 0.02 | |
| Net Earnings | | $ | 0.09 | | | $ | 0.03 | | | $ | (0.24 | ) | | $ | 0.06 | | | $ | (0.06 | ) |
| Diluted earnings (loss) per share | | | | | | | | | | | | | | | | | | | | |
| Earnings (loss) from continuing operations | | $ | 0.07 | | | $ | 0.01 | | | $ | (0.23 | ) | | $ | 0.06 | | | $ | (0.08 | ) |
| Earnings (loss) from discontinued operations | | | 0.02 | | | | 0.02 | | | | (0.01 | ) | | | - | | | | 0.02 | |
| Net Earnings | | $ | 0.09 | | | $ | 0.03 | | | $ | (0.24 | ) | | $ | 0.06 | | | $ | (0.06 | ) |
NOTE 18 – COSTS ASSOCIATED WITH COMPANY-OWNED STORE CLOSURES
Costs associated with Company-owned store asset disposals at February 28, 2023, 2022 and 2021 were comprised of the following:
| | | 2023 | | | 2022 | | | 2021 | |
| Loss on distribution of assets | | $ | - | | | $ | - | | | $ | 57,100 | |
| | | | | | | | | | | | | |
| Total | | $ | - | | | $ | - | | | $ | 57,100 | |
NOTE 19 – CONTESTED SOLICITATION OF PROXIES AND CHANGE IN CONTROL PAYMENTS
Contested Solicitation of Proxies
During FY 2023 and FY 2022, the Company incurred substantial costs associated with a contested solicitation of proxies in connection with its 2022 and 2021 annual meeting of stockholders. During FY 2023, the Company incurred approximately $4.1 million of costs associated with the contested solicitation of proxies, compared with $1.7 million of costs incurred during FY 2022 and no comparable costs during FY 2021. These costs are recognized as general and administrative expense in the Consolidated Statement of Operations.
Employment Agreement Payments upon a Change in Control
As described above in Note 12, we have entered into employment agreements with certain of our executives, which contain, among other things, "change in control" severance provisions.
ROCKY MOUNTAIN CHOCOLATE FACTORY, INC. AND SUBSIDIARIES
NOTES TO CONSOLIDATED FINANCIAL STATEMENTS-(Continued)
In connection with Mr. Dudley’s retirement in FY 2023, Mr. Dudley and the Company entered into a Separation Agreement and General Release (the “Separation Agreement”), dated September 30, 2022 (the “Effective Date”). Under the Separation Agreement, Mr. Dudley retired from the Company on the Effective Date and will be entitled, subject to the terms and conditions therein, to the following payments and separation benefits: (i) a cash separation payment amount in accordance with Mr. Dudley’s employment agreement; (ii) acceleration of vesting of Mr. Dudley’s 12,499 unvested restricted stock units as of the Effective Date; (iii) an additional cash severance payment of $70,000; and (iv) Mr. Dudley has agreed to provide consulting services to the Company through December 31, 2022, to the extent requested by the Company, for which he will receive a cash payment of $56,250. In addition, the Separation Agreement includes covenants related to cooperation, solicitation, and employment, as well as the customary release of claims and non-disparagement provisions in favor of the Company. As of February 28, 2023 all of the Company’s obligations under the Separation Agreement were satisfied.
During FY 2022 Bryan J. Merryman agreed to voluntarily step down as President and Chief Executive Officer (“CEO”) of the Company upon the hiring of a new President and CEO for the Company. On May 5, 2022 the Company concluded its search for a new CEO with the announcement that Robert Sarlls will succeed Mr. Merryman as the Company’s CEO beginning on May 9, 2022.
In connection therewith, the Company and Mr. Merryman entered into a letter agreement dated November 8, 2021 (the “Letter Agreement”), effective November 3, 2021 (the “Effective Date”), amending that certain Second Restated Employment Agreement, dated as of February 26, 2019, by and between the Company and Mr. Merryman (the “Current Employment agreement”). Pursuant to the Letter Agreement, among other things, Mr. Merryman agreed to (i) continue as Chief Financial Officer of the Company, and (ii) until the Company hires a new President and CEO, as the interim President and CEO of the Company. Except as specifically set forth in the Letter Agreement, all the terms and provisions of the Current Employment Agreement remain unmodified and in full force and effect. In addition, on November 3, 2021, the Compensation Committee of the Board of Directors recommended, and the Board of Directors unanimously approved, the acceleration of vesting of approximately 66,667 unvested restricted stock units previously granted to Mr. Merryman, such that the restricted stock units are fully vested as of November 3, 2021 (the “RSU Acceleration”). On July 7, 2022 Mr. Merryman retired from the Company and all of the Company’s obligations under the Letter Agreement and the Current Employment Agreement were satisfied.
As a result of these Agreements the Company incurred the following costs during FY 2023 and FY 2022:
| | | 2023 | | | 2022 | |
| Severance compensation: | | $ | 928,938 | | | $ | 1,344,813 | |
| Accelerated restricted stock unit compensation expense: | | | 95,156 | | | | 525,000 | |
| Consulting Services: | | | 56,250 | | | | - | |
| | | | | | | | | |
| Total | | $ | 1,080,344 | | | $ | 1,869,813 | |
These costs are recognized as general and administrative expense in the Consolidated Statement of Operations.
NOTE 20 – DISCONTINUED OPERATIONS
On February 24, 2023 and May 1, 2023 the Company entered into agreements to sell: 1) All operating assets and inventory associated with the Company’s three U-Swirl Company-owned locations, and 2) All franchise rights and intangible assets associated with the franchise operations of U-Swirl, respectively. As a result of these asset sales, the activities of the Company’s subsidiary, U-Swirl, which were previously recorded to the U-Swirl operating segment are reported as discontinued operations in the Consolidated Statement of Operations, Consolidated Balance Sheet and Consolidated Statement of Cash flows for all periods presented. The majority of the assets and liabilities of U-Swirl met the accounting criteria to be classified as held for sale and were aggregated and reported on separate lines of the respective statements.
ROCKY MOUNTAIN CHOCOLATE FACTORY, INC. AND SUBSIDIARIES
NOTES TO CONSOLIDATED FINANCIAL STATEMENTS-(Continued)
The following table discloses the results of operations of the businesses reported as discontinued operations for the years ended February 28, 2023, 2022 and 2021, respectively:
| | | FOR THE YEARS ENDED FEBRUARY 28, | |
| | | 2023 | | | 2022 | | | 2021 | |
| Total Revenue | | $ | 3,128,368 | | | $ | 2,854,031 | | | $ | 1,717,524 | |
| Cost of sales | | | 654,353 | | | | 556,933 | | | | 320,068 | |
| Operating Expenses | | | 2,048,129 | | | | 2,087,021 | | | | 2,142,310 | |
| Other income (expense), net | | | - | | | | (137 | ) | | | (108,380 | ) |
| Earnings (loss) from discontinued operations before income taxes | | | 425,886 | | | | 210,214 | | | | (636,474 | ) |
| Income tax provision (benefit) | | | 618,308 | | | | 52,194 | | | | (146,419 | ) |
| Earnings (loss) from discontinued operations, net of tax | | $ | (192,422 | ) | | $ | 158,020 | | | $ | (490,055 | ) |
The following table reflects the summary of assets and liabilities held for sale for U-Swirl as of February 28, 2023 and 2022, respectively:
| | | AS OF FEBRUARY 28, | |
| | | 2023 | | | 2022 | |
| Accounts and notes receivable, net | | $ | 75,914 | | | $ | 62,078 | |
| Inventory, net | | | 6,067 | | | | 56,319 | |
| Other | | | 1,023 | | | | 8,467 | |
| Current assets held for sale | | | 83,004 | | | | 126,864 | |
| | | | | | | | | |
| Property and equipment, net | | | - | | | | 48,702 | |
| Franchise rights, net | | | 1,708,336 | | | | 2,078,066 | |
| Intangible assets, net | | | 48,095 | | | | 58,853 | |
| Deferred income taxes | | | - | | | | 666,108 | |
| Other | | | 9,415 | | | | 34,061 | |
| Long-term assets held for sale | | | 1,765,846 | | | | 2,885,790 | |
| Total Assets Held for Sale | | | 1,848,850 | | | | 3,012,654 | |
| | | | | | | | | |
| Accounts payable | | | 125,802 | | | | 83,909 | |
| Accrued compensation | | | 11,205 | | | | 49,312 | |
| Accrued liabilities | | | 11,981 | | | | 15,388 | |
| Contract liabilities | | | 29,951 | | | | 24,634 | |
| Current liabilities held for sale | | | 178,939 | | | | 173,243 | |
| | | | | | | | | |
| Contract liabilities, less current portion | | | 184,142 | | | | 159,602 | |
| Long term liabilities held for sale | | | 184,142 | | | | 159,602 | |
| Total Liabilities Held for Sale | | $ | 363,081 | | | $ | 332,845 | |
ITEM 9. CHANGES IN AND DISAGREEMENTS WITH ACCOUNTANTS ON ACCOUNTING AND FINANCIAL DISCLOSURE
None.
ITEM 9A. CONTROLS AND PROCEDURES
Disclosure Controls and Procedures and Changes in Internal Control Over Financial Reporting
Disclosure Controls and Procedures — The Company maintains disclosure controls and procedures (as defined in Rules 13a-15(e) and 15d-15(e) under the Exchange Act), that are designed to ensure that material information relating to the Company is made known to the officers who certify the Company’s financial reports and to other members of senior management and the Board of Directors. These disclosure controls and procedures are designed to ensure that information required to be disclosed in the Company’s reports that are filed or submitted under the Exchange Act, are recorded, processed, summarized, and reported within the time periods specified in the SEC’s rules and forms. Disclosure controls and procedures include, without limitation, controls and procedures designed to ensure that information required to be disclosed in the reports that the Company files or submits under the Exchange Act is accumulated and communicated to our management, including our principal executive and principal financial officer, or persons performing similar functions, as appropriate to allow timely decisions regarding required disclosure.
Management, under the supervision and with the participation of our Chief Executive Officer and Chief Financial Officer, has conducted an evaluation (pursuant to Rule 13a-15(b) of the Exchange Act), as of February 28, 2023, of the Company’s disclosure controls and procedures. Based on that evaluation, our Chief Executive Officer and Chief Financial Officer have concluded that the Company’s disclosure controls and procedures were not effective as of February 28, 2023, due to the material weaknesses in our internal controls over financial reporting described below.
Management’s Annual Report on Internal Control over Financial Reporting — Management is responsible for establishing and maintaining adequate internal control over financial reporting (as defined in Rule 13a-15(f) and 15d-15(f) under the Exchange Act). The Company’s internal control over financial reporting is a process designed under supervision of the Company’s principal executive officer and principal financial officer to provide reasonable assurance regarding the reliability of financial reporting and preparation of the Company’s consolidated financial statements for external purposes in accordance with generally accepted accounting principles. Management, with the participation of our Chief Executive Officer and Chief Financial Officer, has evaluated the effectiveness, as of February 28, 2023, of the Company’s internal control over financial reporting. In making this evaluation, management used the criteria set forth by the Committee of Sponsoring Organizations of the Treadway Commission in its publication Internal Control-Integrated Framework (2013). Based on that evaluation, management concluded that the Company’s internal control over financial reporting was not effective as of February 28, 2023, due to a material weakness in our internal controls resulting from our finance department not being able to process and account for complex, non-routine transactions in accordance with GAAP. Management concluded that we lack a sufficient number of trained professionals with technical accounting expertise to process and account for complex and non-routine transactions. A material weakness is a deficiency, or combination of deficiencies, in internal control over financial reporting, such that there is a reasonable possibility that a material misstatement of our annual or interim financial statements will not be prevented or detected on a timely basis. Notwithstanding the material weakness identified above, management has concluded that our consolidated financial statements included in this Annual Report fairly present in all material respects the financial condition, results of operations and cash flows of the Company in accordance with GAAP for each of the periods presented therein.
In order to remediate this matter, we plan to retain the assistance of an accounting expert to assist in the accounting and reporting of complex, non-routine transactions. We will consider the material weakness to be fully remediated once the applicable controls operate for a sufficient period of time and our management has concluded, through testing, that these controls are operating effectively.
Under the applicable SEC rules, we are not required to include an attestation report of our independent registered public accounting firm, Plante & Moran, PLLC, on the Company’s internal control over financial reporting.
Changes in Internal Control over Financial Reporting —There were no changes in our internal control over financial reporting that occurred during the quarter ended February 28, 2023, that have materially affected, or are reasonably likely to materially affect, the Company’s internal control over financial reporting.
ITEM 9B. OTHER INFORMATION
None.
ITEM 9C. DISCLOSURE REGARDING FOREIGN JURISDICTIONS THAT PREVENT INSPECTIONS
Not Applicable.
PART III.
ITEM 10. DIRECTORS, EXECUTIVE OFFICERS AND CORPORATE GOVERNANCE
The information required by this item is incorporated herein by reference from our Definitive Proxy Statement for our 2023 Annual Meeting of Stockholders, to be filed no later than 120 days after February 28, 2023.
ITEM 11. EXECUTIVE COMPENSATION
The information required by this item is incorporated herein by reference from our Definitive Proxy Statement for our 2023 Annual Meeting of Stockholders, to be filed no later than 120 days after February 28, 2023.
ITEM 12. SECURITY OWNERSHIP OF CERTAIN BENEFICIAL OWNERS AND MANAGEMENT AND RELATED STOCKHOLDER MATTERS
Except for the information below, the information required by this item is incorporated herein by reference from our Definitive Proxy Statement for our 2023 Annual Meeting of Stockholders, to be filed no later than 120 days after February 28, 2023.
Equity Compensation Plan Information
The following table provides information with respect to the Company’s equity compensation plan, as of February 28, 2023, which consists solely of the Company’s 2007 Equity Incentive Plan:
| Plan category |
|
Number of securities to be issued upon exercise of outstanding options, warrants and rights (1) |
|
|
Weighted-average exercise price of outstanding options, warrants and rights (1) |
|
|
Number of securities remaining available for future issuance under equity compensation plans (excluding securities reflected in column(a)) (2) |
|
| Equity compensation plans approved by the Company’s stockholders |
|
154,131 |
|
|
n/a |
|
|
163,206 |
|
| Equity compensation plans not approved by the Company’s stockholders |
|
-0- |
|
|
-0- |
|
|
-0- |
|
| Total |
|
154,131 |
|
|
n/a |
|
|
163,206 |
|
| |
(1) |
Awards outstanding under the 2007 Equity Incentive Plan as of February 28, 2023 consist of 154,131 unvested restricted stock units. |
| |
(2) |
Represents shares remaining available under the Company’s 2007 Equity Incentive Plan. Shares available for future issuances under the 2007 Equity Incentive Plan may be issued in the form of stock options, stock appreciation rights, restricted stock and stock units, performance shares and performance units, and other stock and cash based awards. |
ITEM 13. CERTAIN RELATIONSHIPS AND RELATED TRANSACTIONS, AND DIRECTOR INDEPENDENCE
The information required by this item is incorporated herein by reference from our Definitive Proxy Statement for our 2023 Annual Meeting of Stockholders, to be filed no later than 120 days after February 28, 2023.
ITEM 14. PRINCIPAL ACCOUNTANT FEES AND SERVICES
The information required by this item is incorporated herein by reference from our Definitive Proxy Statement for our 2023 Annual Meeting of Stockholders, to be filed no later than 120 days after February 28, 2023.
PART IV.
ITEM 15. EXHIBITS, FINANCIAL STATEMENT SCHEDULES
| (a) |
The following documents are filed as part of this Annual Report: |
| |
2. |
Financial Statement Schedule |
Schedule II
Valuation and Qualifying Accounts
| |
|
Balance at Beginning of Period |
|
|
Additions Charged to Costs & Exp. |
|
|
Deductions |
|
|
Balance at End of Period |
|
| Year Ended February 28, 2023 |
|
|
|
|
|
|
|
|
|
|
|
|
|
|
|
|
| Valuation Allowance for Accounts and Notes Receivable |
|
|
983,022 |
|
|
|
(173,600 |
) |
|
|
45,517 |
|
|
|
763,905 |
|
| |
|
|
|
|
|
|
|
|
|
|
|
|
|
|
|
|
| Year Ended February 28, 2022 |
|
|
|
|
|
|
|
|
|
|
|
|
|
|
|
|
| Valuation Allowance for Accounts and Notes Receivable |
|
|
1,454,140 |
|
|
|
- |
|
|
|
471,118 |
|
|
|
983,022 |
|
| |
|
|
|
|
|
|
|
|
|
|
|
|
|
|
|
|
| Year Ended February 28, 2021 |
|
|
|
|
|
|
|
|
|
|
|
|
|
|
|
|
| Valuation Allowance for Accounts and Notes Receivable |
|
|
638,907 |
|
|
|
1,257,010 |
|
|
|
441,777 |
|
|
|
1,454,140 |
|
3. Exhibits
The exhibits listed on the Exhibit Index are filed as part of this Form 10-K.
EXHIBIT INDEX
| Exhibit Number |
|
Description |
|
Incorporated by Reference or
Filed/Furnished Herewith |
| 2.1 |
|
Asset Purchase Agreement, dated May 1, 2023, by and among U-Swirl International, Inc., a Nevada corporation, U Swirl, LLC, a Delaware limited liability company, and Rocky Mountain Chocolate Factory, Inc., a Delaware corporation |
|
Exhibit 2.1 to the Current Report on Form 8-K filed on May 4, 2023 (File No. 001-36865) |
| |
|
|
|
|
| 3.1 |
|
Amended and Restated Certificate of Incorporation of Rocky Mountain Chocolate Factory, Inc., a Delaware corporation |
|
Exhibit 3.1 to the Current Report on Form 8-K12G3 filed on March 2, 2015 (File No. 001-36865) |
| |
|
|
|
|
| 3.2 |
|
Second Amended and Restated Bylaws of Rocky Mountain Chocolate Factory, Inc. |
|
Exhibit 3.1 to the Current Report on Form 8-K filed on December 10, 2019 (File No. 001-36865) |
| |
|
|
|
|
| 4.1** |
|
Description of Securities |
|
Filed herewith. |
| |
|
|
|
|
| 10.1** |
|
Form of Employment Agreement (Officers) |
|
Exhibit 10.1 to the Annual Report on Form 10-K for the fiscal year ended February 28, 2007 (File No. 000-14749) |
| |
|
|
|
|
| 10.2 |
|
Form of Franchise Agreement for Rocky Mountain Chocolate Factory |
|
Exhibit 10.1 to the Quarterly Report on Form 10-Q for the quarter ended May 31, 2010 (File No. 000-14749) |
| |
|
|
|
|
| 10.3** |
|
Rocky Mountain Chocolate Factory, Inc. 2007 Equity Incentive Plan (as Amended and Restated) |
|
Exhibit 10.1 to the Current Report on Form 8-K filed on September 18, 2020 (File No. 001-36865) |
| |
|
|
|
|
| 10.4** |
|
Form of Indemnification Agreement (Directors) |
|
Exhibit 10.7 to the Annual Report on Form 10-K for the fiscal year ended February 28, 2007 (File No. 000-14749) |
| |
|
|
|
|
| 10.5** |
|
Form of Indemnification Agreement (Officers) |
|
Exhibit 10.8 to the Annual Report on Form 10-K for the fiscal year ended February 28, 2007 (File No. 000-14749) |
| |
|
|
|
|
| 10.6* |
|
Master License Agreement, dated August 17, 2009, between Kahala Franchise Corp. and Rocky Mountain Chocolate Factory, Inc., a Colorado corporation |
|
Exhibit 10.3 to the Quarterly Report on Form 10-Q of the Registrant for the quarter ended August 31, 2009 (File No. 000-14749) |
| |
|
|
|
|
| 10.7 |
|
Credit Agreement, dated October 13, 2021, between Wells Fargo Bank, National Association and Rocky Mountain Chocolate Factory, Inc. |
|
Exhibit 10.3 to the Current Report on Form 8-K filed on October 6, 2022 (File No. 001-36865) |
| |
|
|
|
|
| 10.8 |
|
First Amendment to Credit Agreement, dated September 26, 2022, between Wells Fargo Bank, National Association and Rocky Mountain Chocolate Factory, Inc. |
|
Exhibit 10.1 to the Current Report on Form 8-K filed on October 6, 2022 (File No. 001-36865) |
| |
|
|
|
|
| 10.9 |
|
Revolving Line of Credit Note, dated September 26, 2022, between Wells Fargo Bank, National Association and Rocky Mountain Chocolate Factory, Inc. |
|
Exhibit 10.2 to the Current Report on Form 8-K filed on October 6, 2022 (File No. 001-36865) |
| 10.10† |
|
Settlement and Release Agreement, dated December 14, 2022, between Bradley L. Radoff, Andrew T. Berger, AB Value Management LLC, Mary Bradley and Rocky Mountain Chocolate Factory, Inc. |
|
Exhibit 10.1 to the Current Report on Form 8-K filed on December 16, 2022 (File No. 001-36865) |
| |
|
|
|
|
| 10.11** |
|
Offer Letter, dated May 3, 2022, between Rocky Mountain Chocolate Factory, Inc. and Robert J. Sarlls. |
|
Exhibit 10.1 to the Current Report on Form 8-K filed on May 6, 2022 (File No. 001-36865) |
| |
|
|
|
|
| 10.12** |
|
Retirement Agreement and General Release, dated May 3, 2023, between Rocky Mountain Chocolate Factory, Inc., a Delaware Corporation, and Gregory L. Pope |
|
Exhibit 10.1 to the Current Report on Form 8-K filed on May 8, 2023 (File No. 001-36865) |
| |
|
|
|
|
| 10.13** |
|
Offer Letter, dated July 15, 2022, between Rocky Mountain Chocolate Factory, Inc. and Allen Arroyo |
|
Exhibit 10.1 to the Current Report on Form 8-K filed on July 21, 2022 (File No. 001-36865) |
| |
|
|
|
|
| 10.14 |
|
Secured Promissory Note, dated May 1, 2023, by and between U Swirl, LLC, a Delaware limited liability company, and U-Swirl International, Inc., a Nevada corporation |
|
Exhibit 10.1 to the Current Report on Form 8-K filed on May 4, 2023 (File No. 001-36865) |
| |
|
|
|
|
| 10.15 |
|
Security Agreement, dated May 1, 2023, by and among U-Swirl International, Inc., a Nevada corporation, Bob Partners X, LLC, a Delaware limited liability company, U Swirl, LLC, a Delaware limited liability company, U Swirl Franchising LLC, a Delaware limited liability company, and U Swirl Gift Card LLC |
|
Exhibit 10.2 to the Current Report on Form 8-K filed on May 4, 2023 (File No. 001-36865) |
| |
|
|
|
|
| 10.16 |
|
Pledge Agreement, dated May 1, 2023, by and among, U Swirl, LLC, a Delaware limited liability company, U-Swirl International, Inc., a Nevada corporation, Bob Partners X, LLC, a Delaware limited liability company, and certain persons named therein |
|
Exhibit 10.3 to the Current Report on Form 8-K filed on May 4, 2023 (File No. 001-36865) |
| |
|
|
|
|
| 21.1 |
|
Subsidiaries of the Registrant |
|
Filed herewith. |
| |
|
|
|
|
| 23.1 |
|
Consent of Independent Registered Public Accounting Firm |
|
Filed herewith. |
| |
|
|
|
|
| 31.1 |
|
Certification Pursuant To Section 302 of the Sarbanes-Oxley Act of 2002 |
|
Filed herewith. |
| |
|
|
|
|
| 31.2 |
|
Certification Pursuant To Section 302 of the Sarbanes-Oxley Act of 2002 |
|
Filed herewith. |
| |
|
|
|
|
| 32.1 |
|
Certification Pursuant To Section 906 Of The Sarbanes-Oxley Act of 2002 |
|
Furnished herewith. |
| |
|
|
|
|
| 101.INS |
|
Inline XBRL Instance Document (the Instance Document does not appear in the Interactive Data File because its XBRL tags are embedded within the Inline XBRL document) (1) |
|
Filed herewith. |
| |
|
|
|
|
| 101.SCH |
|
Inline XBRL Taxonomy Extension Schema (1) |
|
Filed herewith. |
| |
|
|
|
|
| 101.CAL |
|
Inline XBRL Taxonomy Extension Calculation Linkbase (1) |
|
Filed herewith. |
| |
|
|
|
|
| 101.DEF |
|
Inline XBRL Taxonomy Extension Definition Linkbase(1) |
|
Filed herewith. |
| |
|
|
|
|
| 101.LAB |
|
Inline XBRL Taxonomy Extension Label Linkbase (1) |
|
Filed herewith. |
| |
|
|
|
|
| 101.PRE |
|
Inline XBRL Taxonomy Extension Presentation Linkbase (1) |
|
Filed herewith. |
| |
|
|
|
|
| 104 |
|
Cover Page Interactive Data File (embedded within the Inline XBRL document and contained in Exhibit 101) |
|
Filed herewith. |
| |
|
|
|
|
| * |
Contains material that has been omitted pursuant to a request for confidential treatment and such material has been filed separately with the SEC. |
| |
|
| ** |
Management contract or compensatory plan required to be filed as an exhibit pursuant to Item 15(c) of Form 10-K. |
| |
|
|
| (1) |
These interactive data files shall not be deemed filed for purposes of Section 11 or 12 of the Securities Act of 1933, as amended, or Section 18 of the Securities Exchange Act of 1937, as amended, or otherwise subject to liability under those sections. |
ITEM 16. FORM 10-K SUMMARY
Not applicable.
SIGNATURES
Pursuant to the requirements of Section 13 or 15(d) of the Securities Exchange Act of 1934, the registrant has duly caused this report to be signed on its behalf by the undersigned, thereunto duly authorized.
| |
ROCKY MOUNTAIN CHOCOLATE FACTORY, INC. |
|
| |
|
|
|
| |
|
|
|
| Date: May 30, 2023 |
|
/s/ Allen Arroyo |
|
| |
|
ALLEN ARROYO |
|
| |
|
Chief Financial Officer |
|
Pursuant to the requirements of the Securities Exchange Act of 1934, this report has been signed below by the following persons on behalf of the registrant and in the capacities and on the dates indicated.
| Date: May 30, 2023 |
|
/s/ Robert J. Sarlls |
|
| |
|
ROBERT J. SARLLS |
|
| |
|
Chief Executive Officer, and Director |
|
| |
|
(Principal Executive Officer) |
|
| |
|
|
|
| |
|
|
|
| Date: May 30, 2023 |
|
/s/ Allen Arroyo |
|
| |
|
ALLEN ARROYO |
|
| |
|
Chief Financial Officer |
|
| |
|
(Principal Financial and |
|
| |
|
Accounting Officer) |
|
| |
|
|
|
| |
|
|
|
| Date: May 30, 2023 |
|
/s/ Jeffrey R. Geygan |
|
| |
|
JEFFREY R. GEYGAN, Chair of Board |
|
| |
|
|
|
| Date: May 30, 2023 |
|
/s/ Starlette B. Johnson |
|
| |
|
STARLETTE B. JOHNSON, Director |
|
| |
|
|
|
| Date: May 30, 2023 |
|
/s/ Mark Riegel |
|
| |
|
MARK RIEGEL, Director |
|
| |
|
|
|
| |
|
|
|
| Date: May 30, 2023 |
|
/s/ Brett P. Seabert |
|
| |
|
BRETT P. SEABERT, Director |
|